Fig. 17
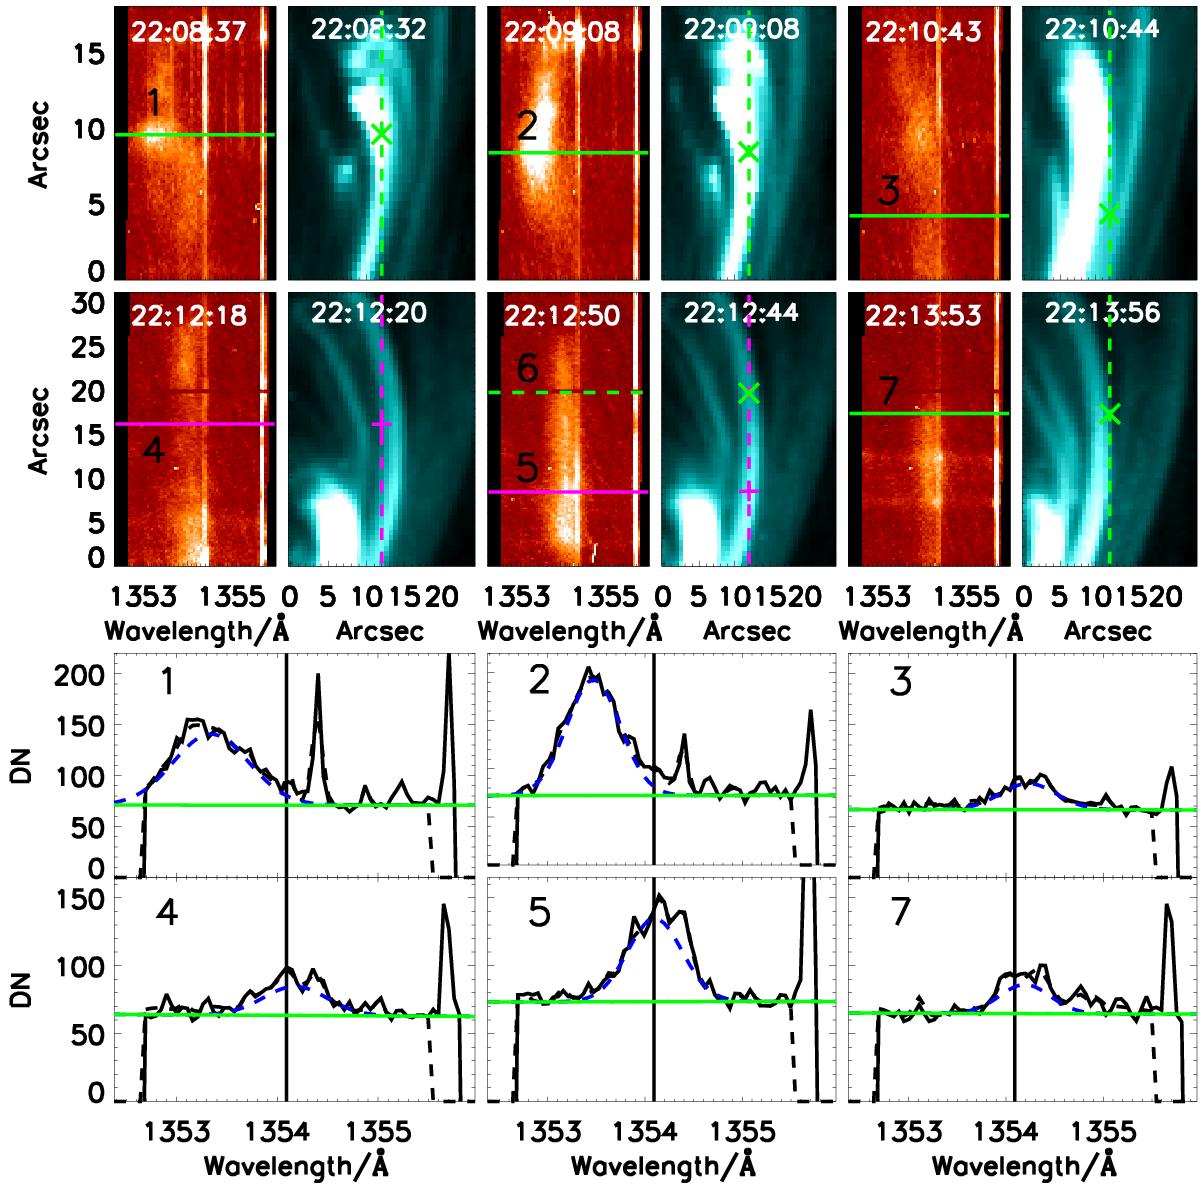
Selected IRIS spectra and AIA intensities for the second flare. The vertical lines in the AIA images mark the positions of the IRIS slits. The numbers on the IRIS images show the positions of the selected points in Fig. 16. The +’s and ×’s in the AIA images mark the positions of these points in the AIA images. Underneath are the IRIS spectra (solid black line) and their fits (black dashed line). The green solid line is the background, the blue dashed line is background + Fe xxi line, while the vertical line is the rest wavelength of Fe xxi line.
Current usage metrics show cumulative count of Article Views (full-text article views including HTML views, PDF and ePub downloads, according to the available data) and Abstracts Views on Vision4Press platform.
Data correspond to usage on the plateform after 2015. The current usage metrics is available 48-96 hours after online publication and is updated daily on week days.
Initial download of the metrics may take a while.