Fig. 14
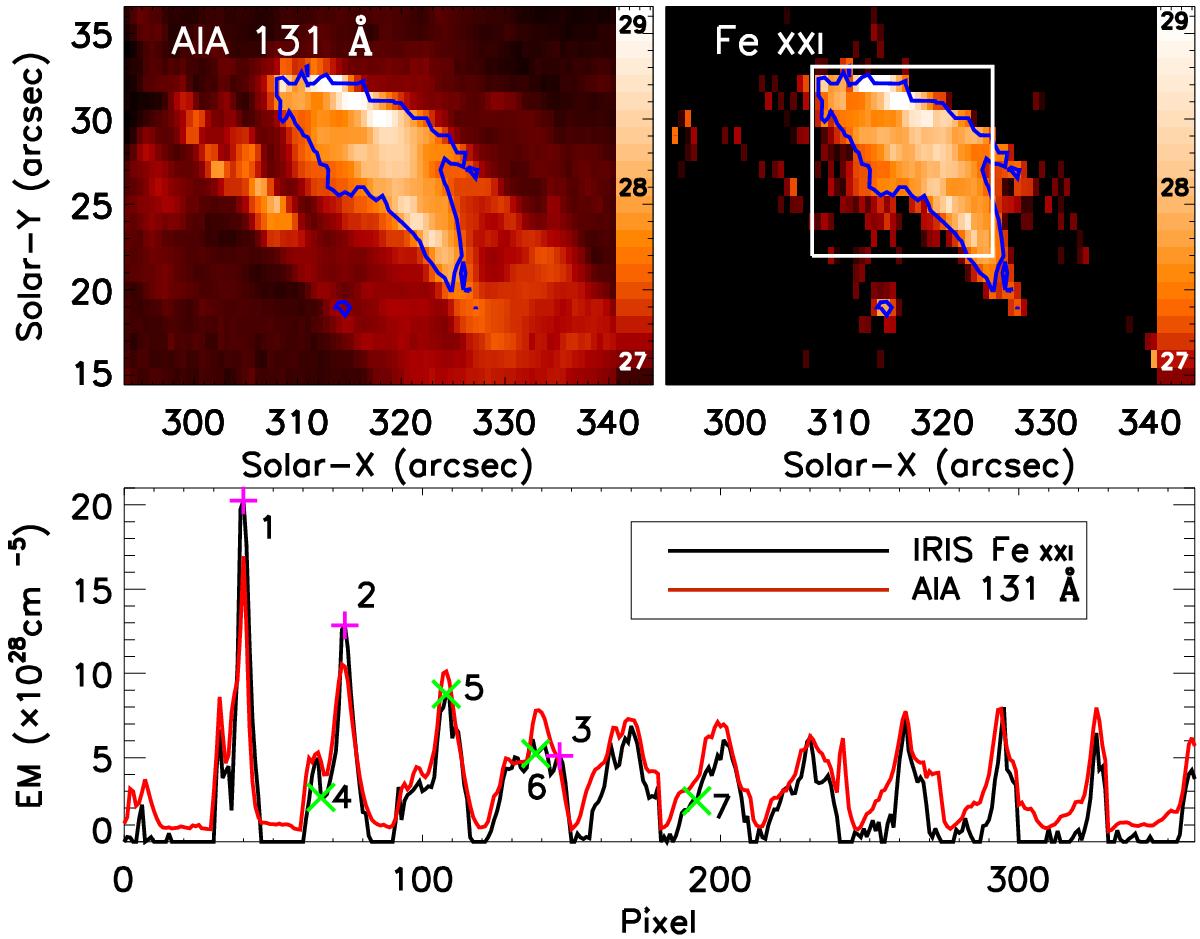
Upper: emission measures computed from AIA 131 Å and IRIS Fe xxi at 11 MK for the first flare. The white box is the region over which we compare EMs in the panels below. Bottom: pixel-by-pixel and row-by-row EMs across the white box region, starting from the upper left. The black line is the Fe xxi EM, and the red line is the 131 Å EM. The +’s indicate those pixels where the Fe xxi emission is higher, and the ×’s mark the selected pixels shown in Fig. 15.
Current usage metrics show cumulative count of Article Views (full-text article views including HTML views, PDF and ePub downloads, according to the available data) and Abstracts Views on Vision4Press platform.
Data correspond to usage on the plateform after 2015. The current usage metrics is available 48-96 hours after online publication and is updated daily on week days.
Initial download of the metrics may take a while.