Fig. 12
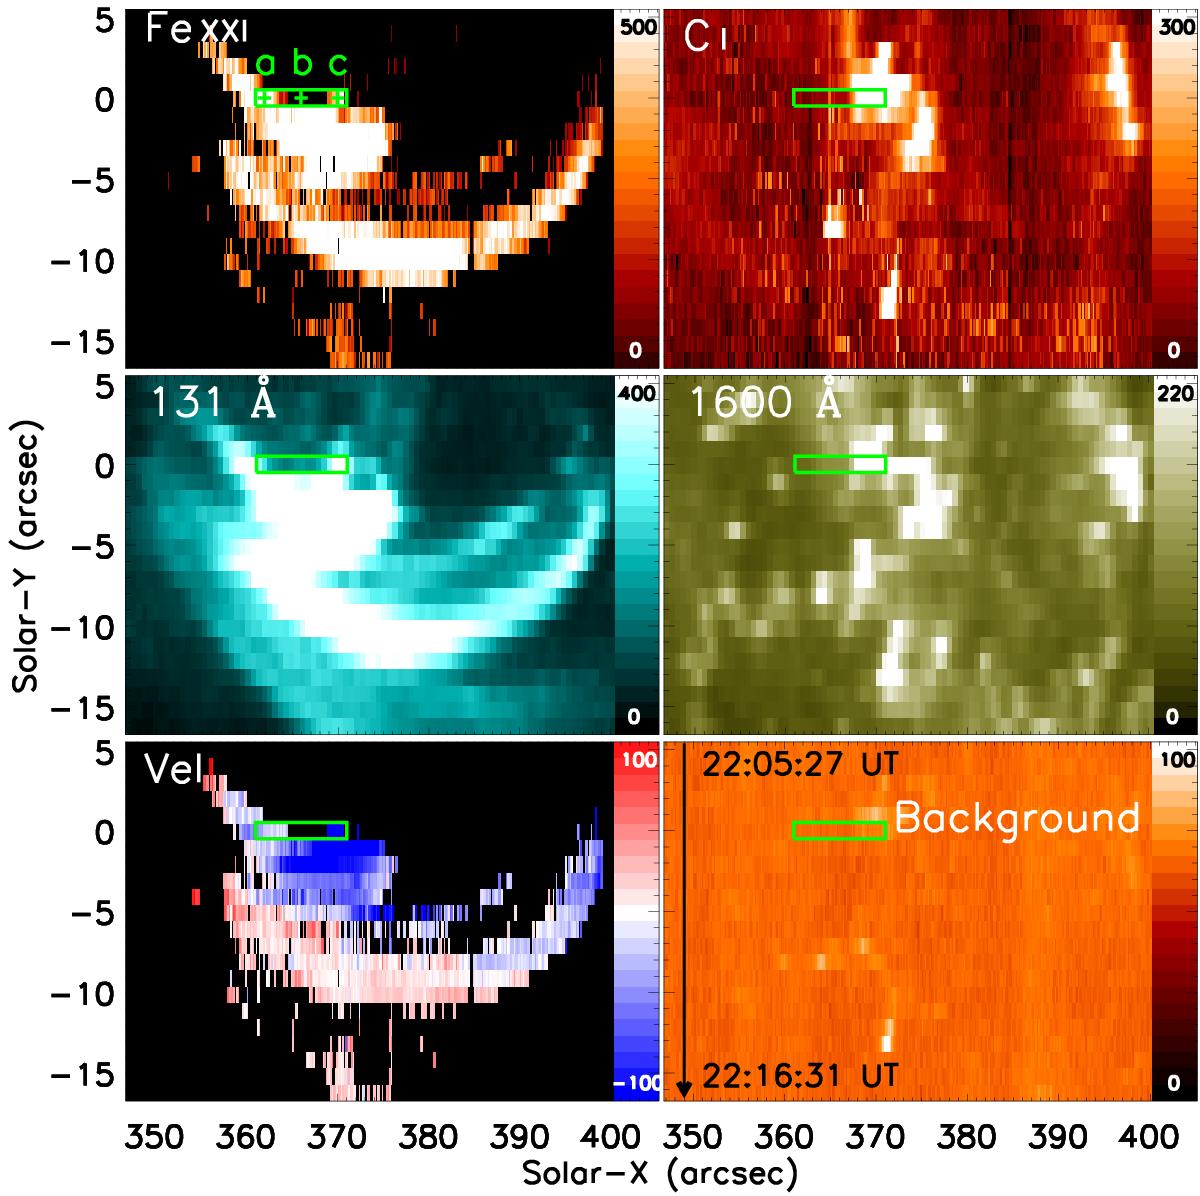
Images of the second flare. (top) IRIS Fe xxi 1354.08 Å and C i 1354.29 Å intensity; (middle) AIA 131 Å and 1600 Å pseudo-raster intensity; (bottom) IRIS Fe xxi Doppler velocity and continuum intensity. The green rectangle marked with +’s indicates the region and sites of the spectra shown in Fig. 13. The arrow indicates the time direction; the duration of these images is 11 m 4 s. The duration of the raster is indicated in Fig. 1.
Current usage metrics show cumulative count of Article Views (full-text article views including HTML views, PDF and ePub downloads, according to the available data) and Abstracts Views on Vision4Press platform.
Data correspond to usage on the plateform after 2015. The current usage metrics is available 48-96 hours after online publication and is updated daily on week days.
Initial download of the metrics may take a while.