Fig. 11
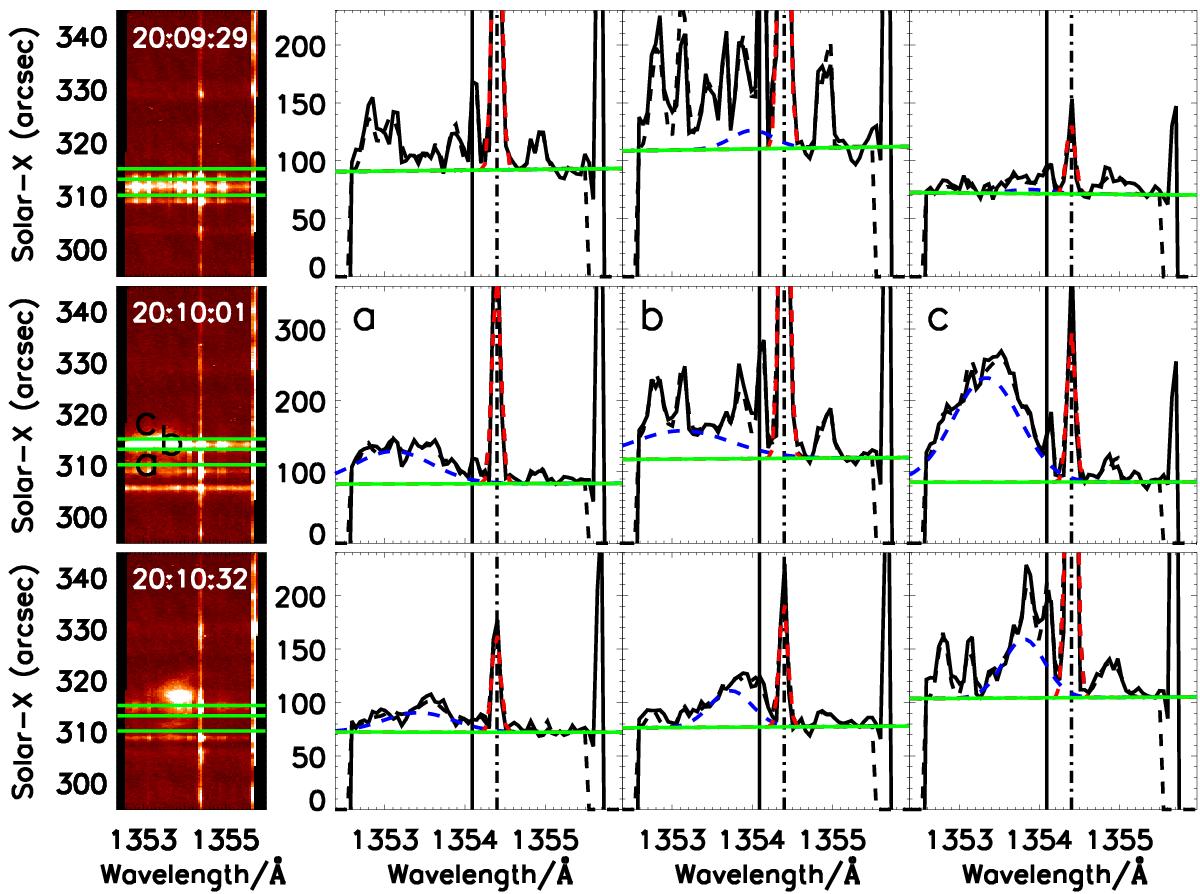
Flare-kernel spectra from the region inside the green rectangle in Fig. 10: (left-middle) the spectrogram of the region marked with a green rectangle in Fig. 10, with before (left-top) and after (left-bottom) spectrograms. The right panels show the spectra (solid) and their fits (dashed) at the positions indicated by the green lines in the left panel. The vertical solid lines give the rest wavelength of Fe xxi and the vertical dashed-dot lines give the rest wavelength of C i line. The green solid line is the background, the blue dashed line is the background + Fe xxi line fit, and the red dashed line is the background + C i line fit.
Current usage metrics show cumulative count of Article Views (full-text article views including HTML views, PDF and ePub downloads, according to the available data) and Abstracts Views on Vision4Press platform.
Data correspond to usage on the plateform after 2015. The current usage metrics is available 48-96 hours after online publication and is updated daily on week days.
Initial download of the metrics may take a while.