Free Access
Fig. 1
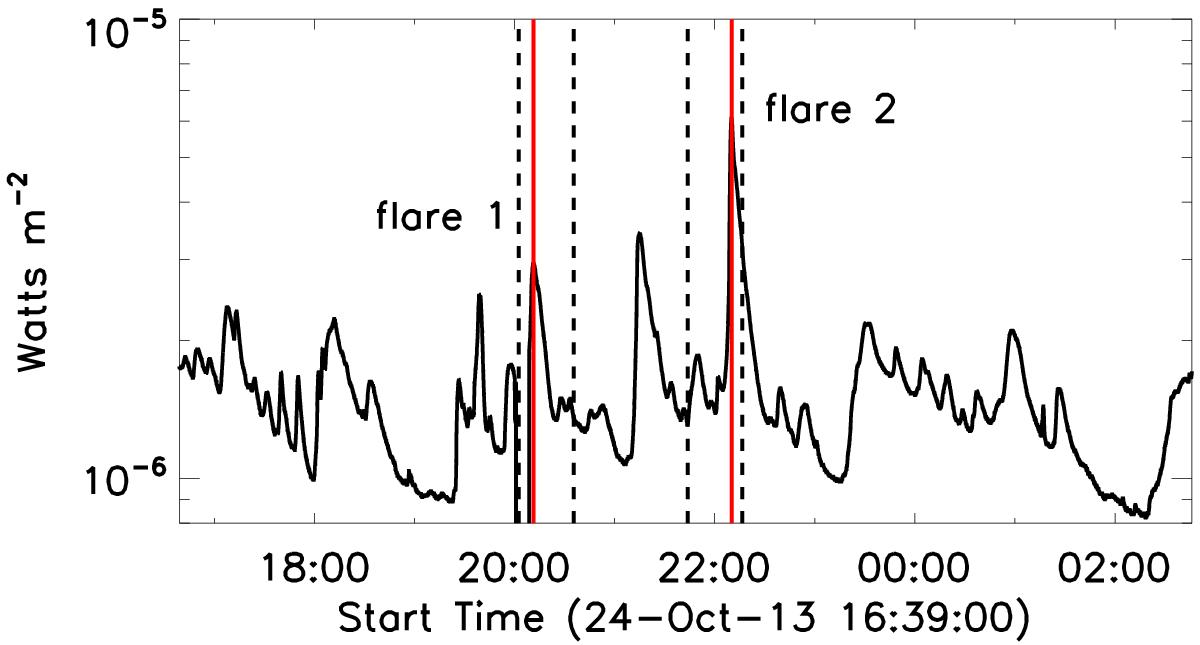
GOES 1.0−8.0 Å flux during the observing period. The two flares analyzed are labeled. Red lines are drawn at the times of the peak flux, while the dashed lines show the start and end times of the of IRIS raster 6 (between 20:02 UT and 20:35 UT) and raster 9 (from 21:43 UT to 22:16 UT).
Current usage metrics show cumulative count of Article Views (full-text article views including HTML views, PDF and ePub downloads, according to the available data) and Abstracts Views on Vision4Press platform.
Data correspond to usage on the plateform after 2015. The current usage metrics is available 48-96 hours after online publication and is updated daily on week days.
Initial download of the metrics may take a while.