Fig. 3
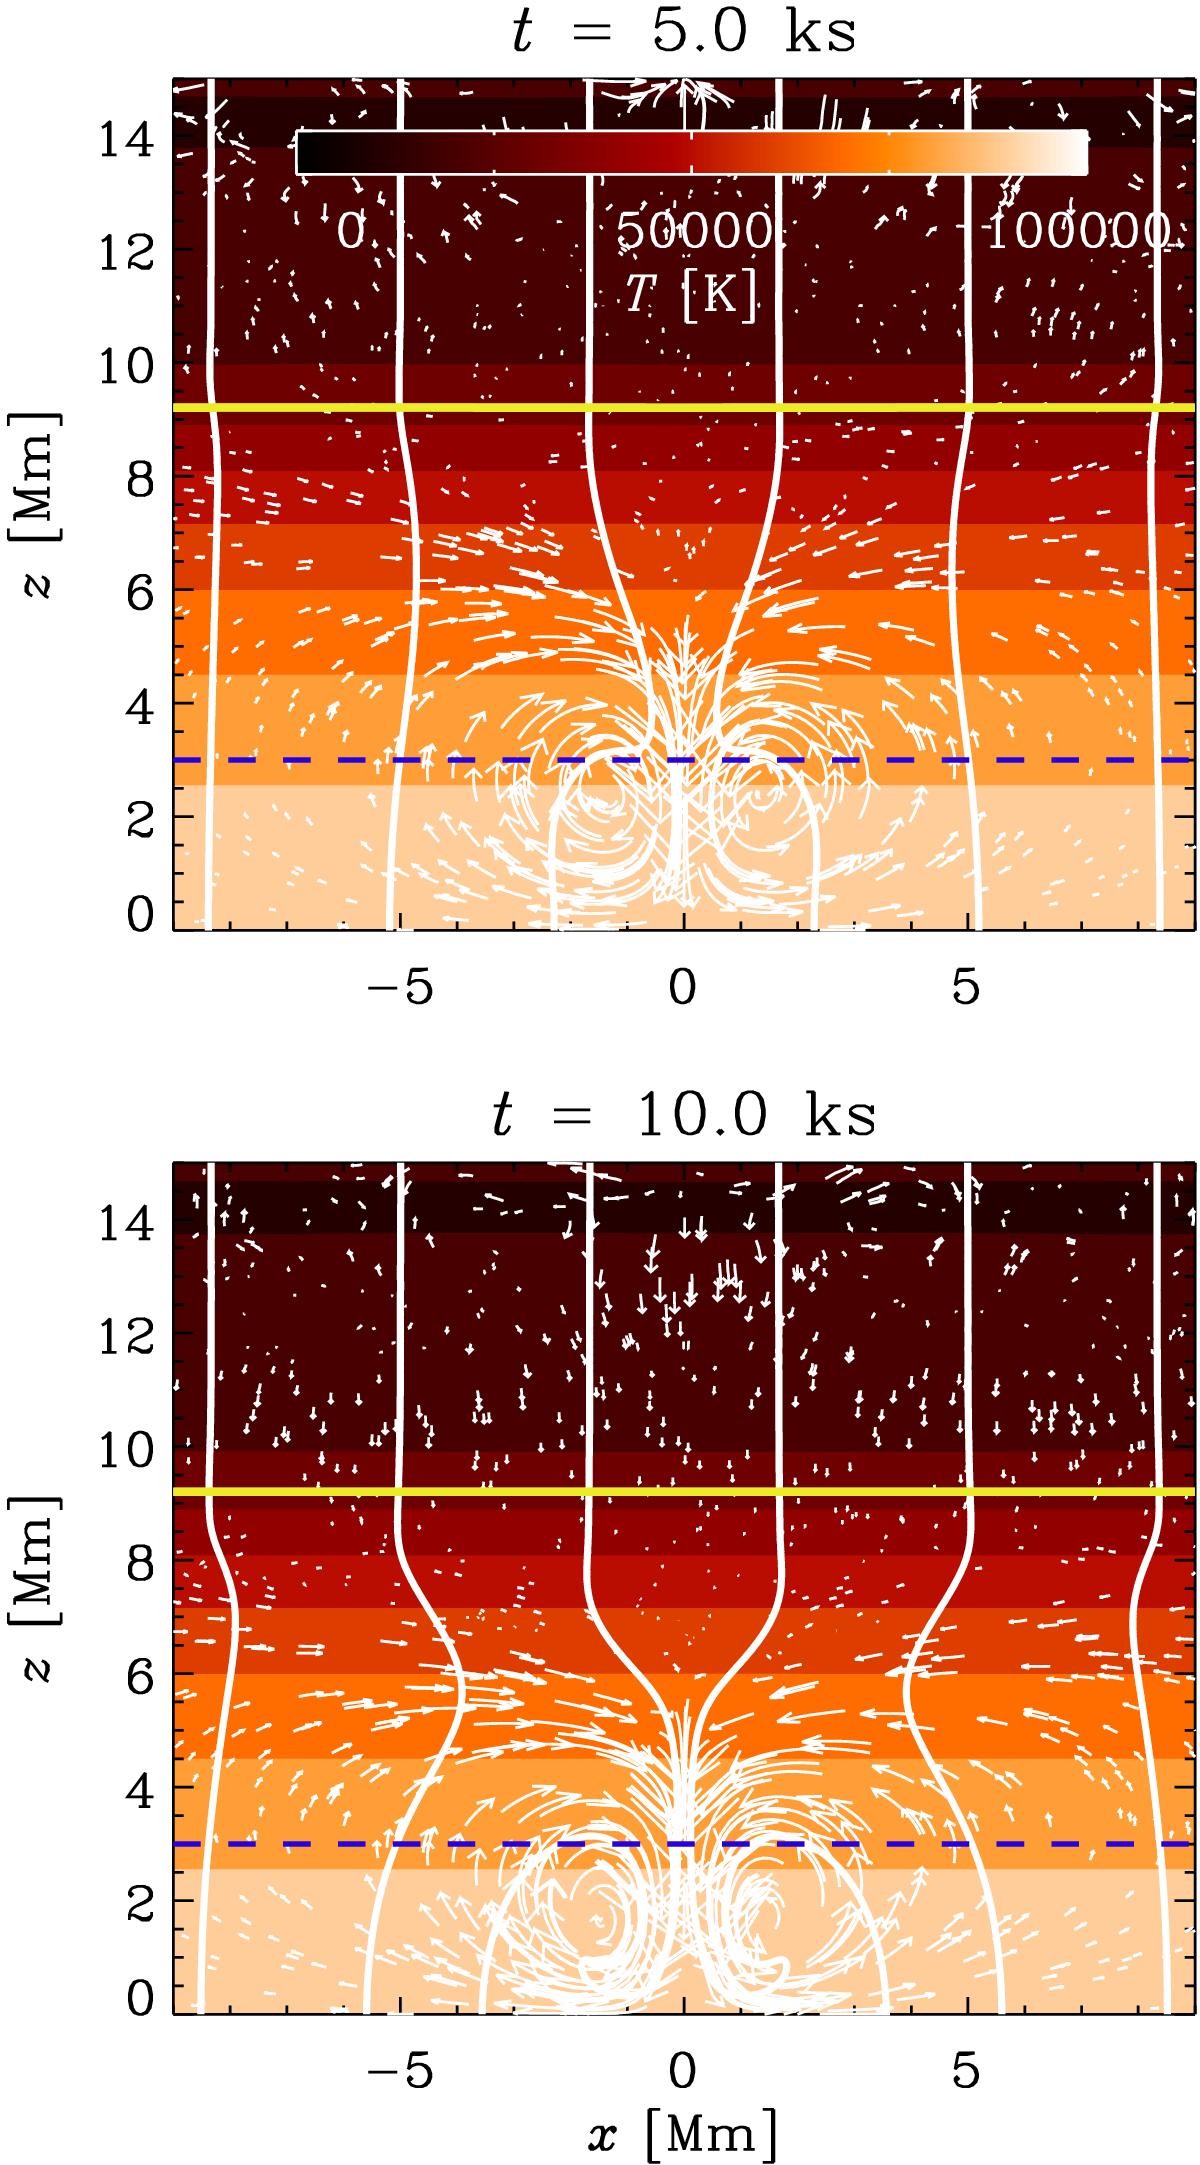
Snapshots of Run F3 (fixed ionization, yH = 1) showing temperature (color coded), magnetic field lines, and velocity vectors at two times before and after the flux concentration develops. The solid yellow line at z ≈ 9 Mm indicates the τ = 1 surface while the dashed blue line indicates the height z0 where suction operates.
Current usage metrics show cumulative count of Article Views (full-text article views including HTML views, PDF and ePub downloads, according to the available data) and Abstracts Views on Vision4Press platform.
Data correspond to usage on the plateform after 2015. The current usage metrics is available 48-96 hours after online publication and is updated daily on week days.
Initial download of the metrics may take a while.