Fig. 9
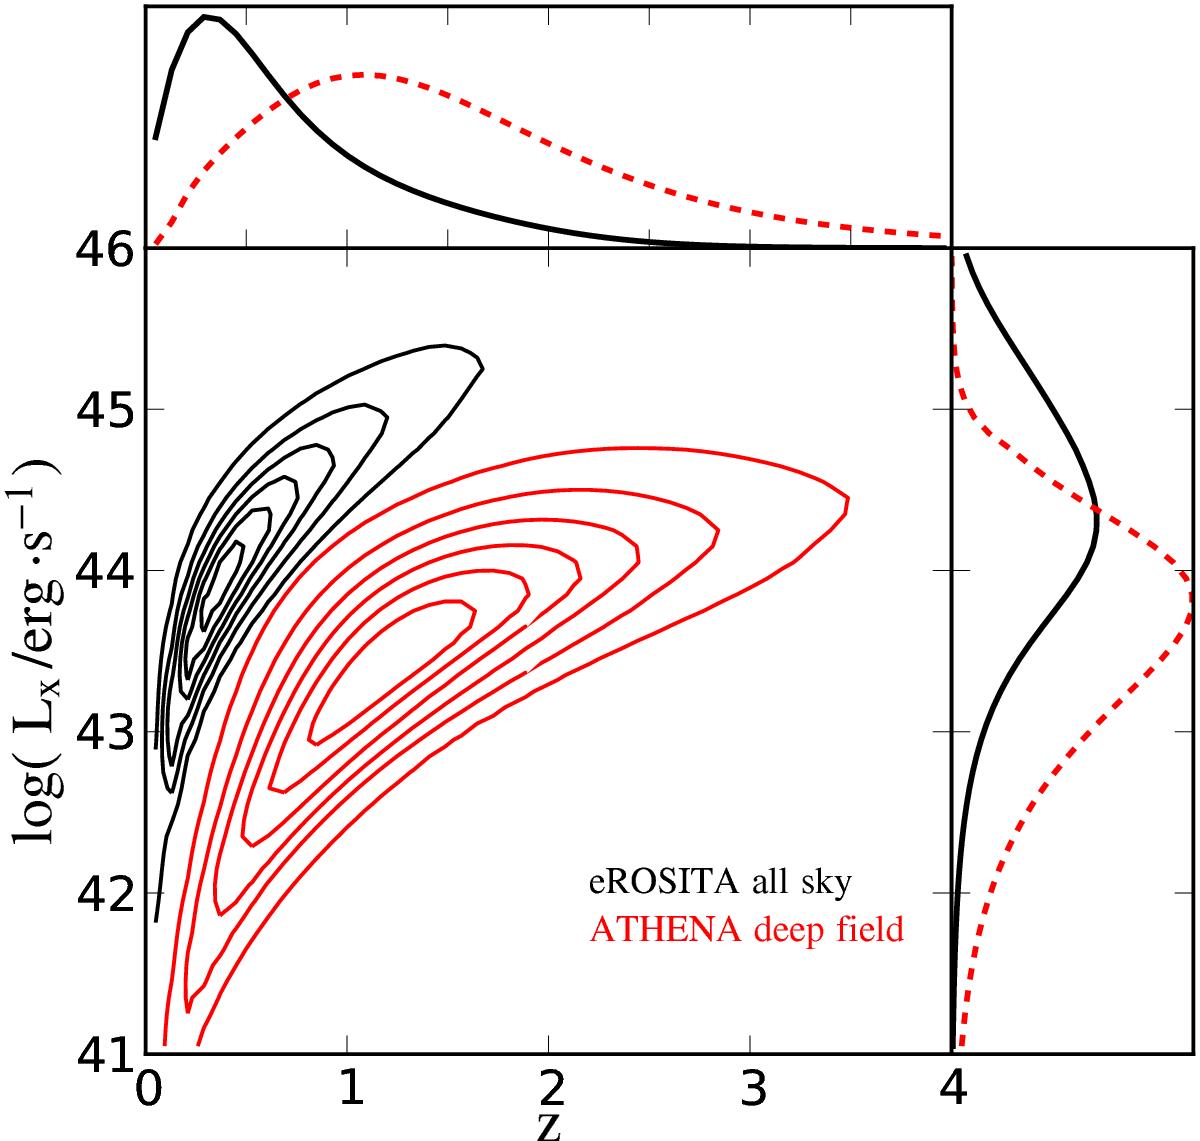
Expected luminosity-redshift plane coverage from the all-sky survey with eROSITA (black curves) and ATHENA (red curves) in the 2−10 keV energy band. Top panel shows the predicted redshift distribution. Panel on the right shows the predicted luminosity distribution. The two missions complement each other and both are pivotal for a precise estimation of the AGN luminosity function.
Current usage metrics show cumulative count of Article Views (full-text article views including HTML views, PDF and ePub downloads, according to the available data) and Abstracts Views on Vision4Press platform.
Data correspond to usage on the plateform after 2015. The current usage metrics is available 48-96 hours after online publication and is updated daily on week days.
Initial download of the metrics may take a while.