Fig. 7
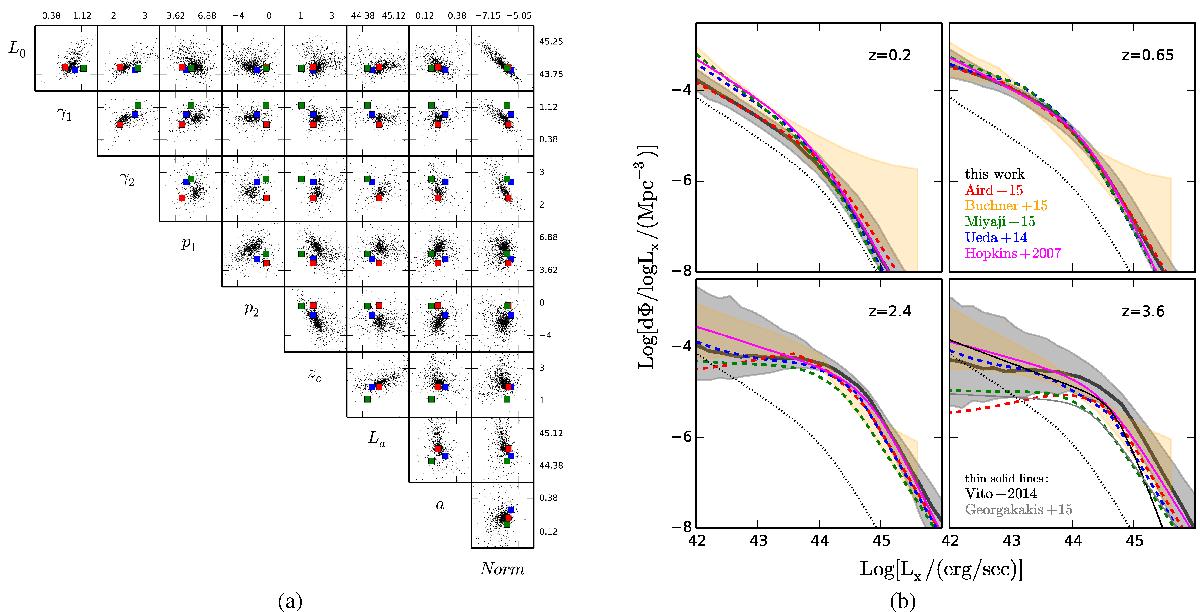
a) Posterior draws from MultiNest (black) and comparison with the point estimates from Ueda et al. (2014) (blue), Miyaji et al. (2015) (green), Aird et al. (2015) (red). b) Comparison of 5−10 keV luminosity function (black line) transformed to 2−10 keV to literature results. The gray area shows the 90% credible interval. Our result is in excellent agreement with the literature up to z = 2.5. At high redshift our result shows a less prominent drop in the faint end of the XLF compared to estimations from Miyaji et al. (2015) (green), Aird et al. (2015) (red), and Georgakakis et al. (2015) (thin black line).
Current usage metrics show cumulative count of Article Views (full-text article views including HTML views, PDF and ePub downloads, according to the available data) and Abstracts Views on Vision4Press platform.
Data correspond to usage on the plateform after 2015. The current usage metrics is available 48-96 hours after online publication and is updated daily on week days.
Initial download of the metrics may take a while.