Fig. 5
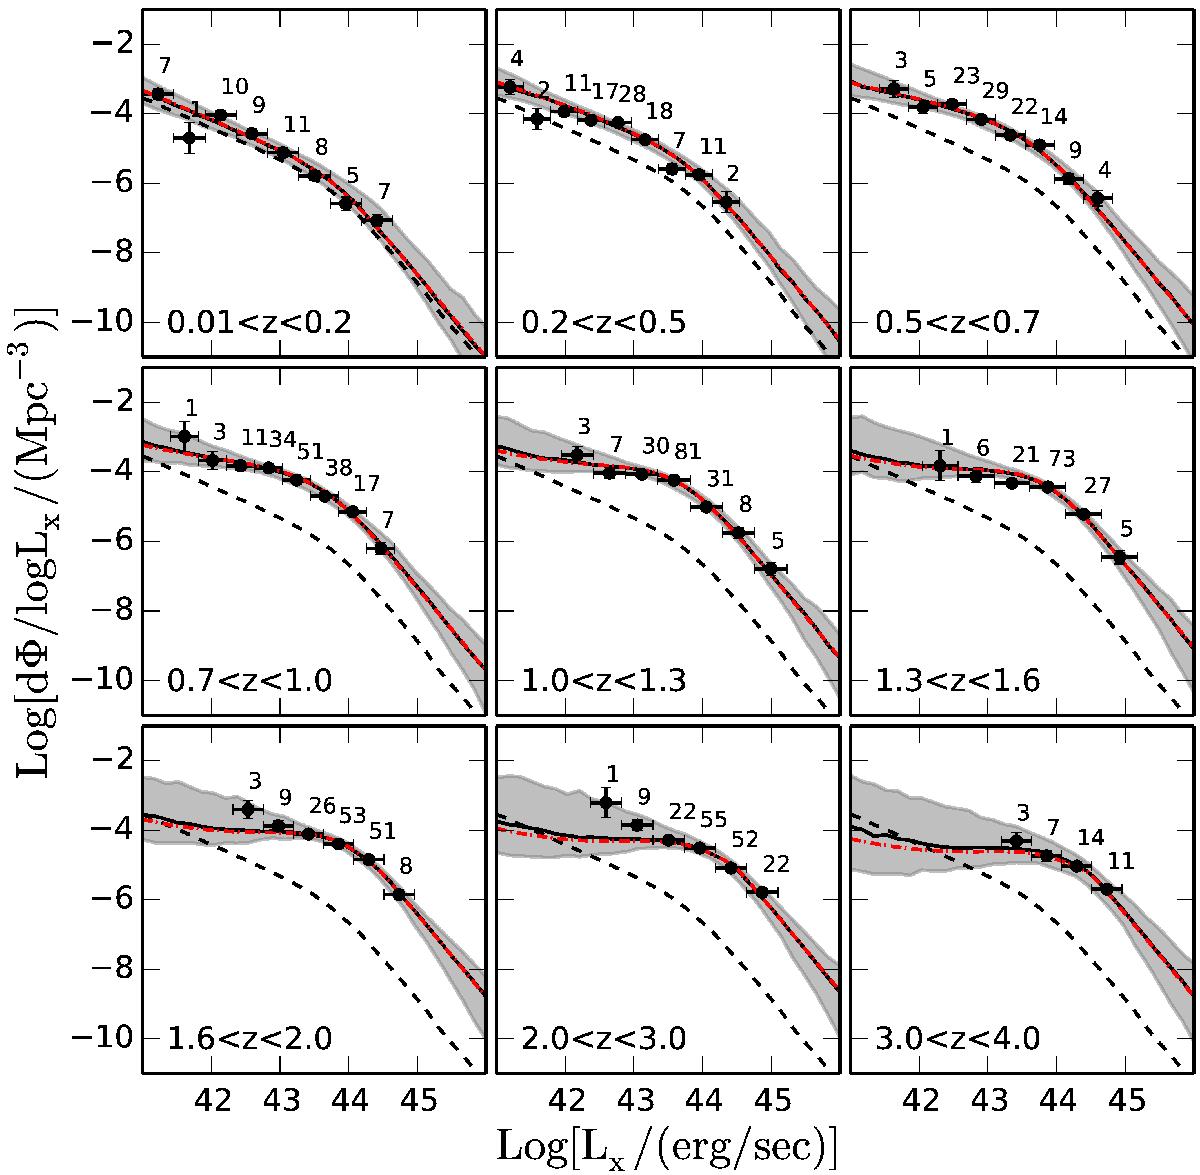
Differential luminosity function versus luminosity for different redshift bins. The number of sources in each bin is given on the top right of each point. The solid black line is the mode of the luminosity function distribution, the gray shaded area encloses the 99% credible interval. The dashed black line shows the estimated luminosity function at z = 0 for comparison. The two red lines show the estimated luminosity function when the two posterior modes are used separately. The points are the binned estimations of the luminosity function, according to the 1 /Vmax method, and they are in excellent agreement with our model.
Current usage metrics show cumulative count of Article Views (full-text article views including HTML views, PDF and ePub downloads, according to the available data) and Abstracts Views on Vision4Press platform.
Data correspond to usage on the plateform after 2015. The current usage metrics is available 48-96 hours after online publication and is updated daily on week days.
Initial download of the metrics may take a while.