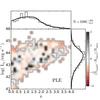
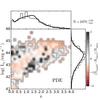
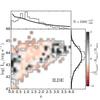
Fig. 4
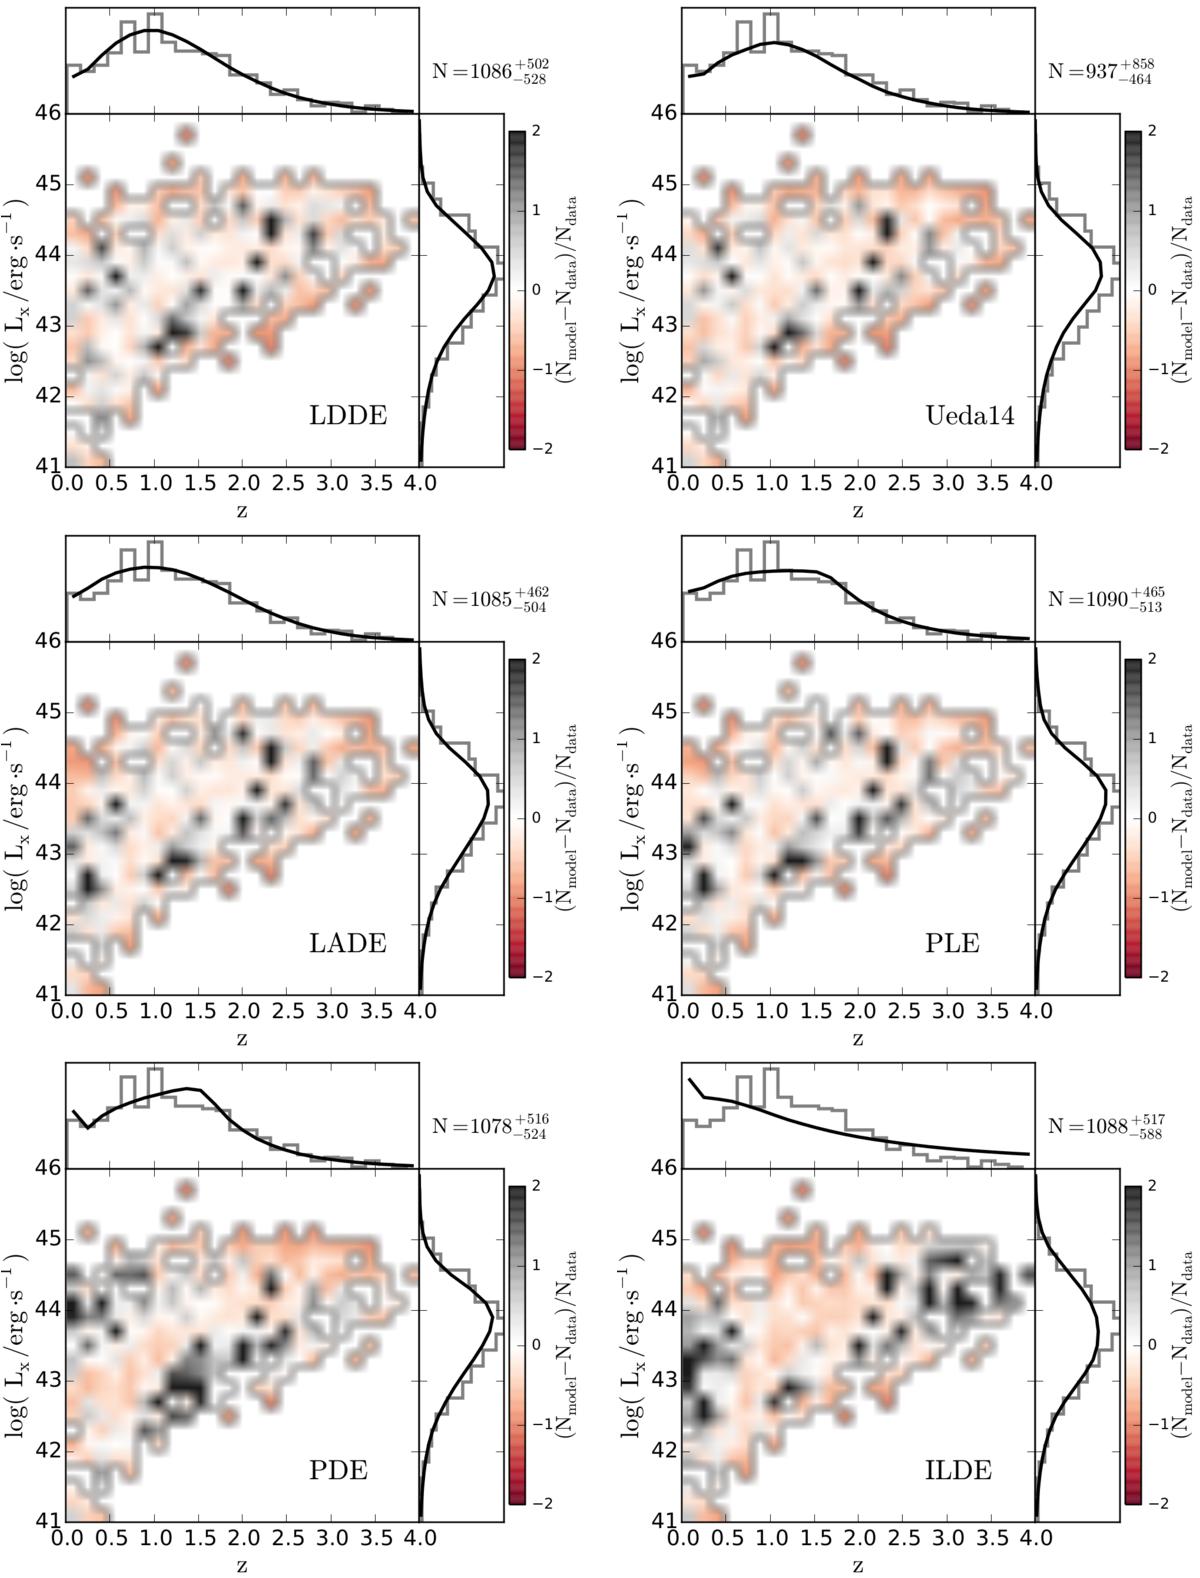
Fractional difference between predicted and observed number of AGN in a luminosity-redshift bin (color scale). The computation of the volume and luminosity function was performed on a 1000 × 1000 grid. The plots are rebinned on a 25 × 25 grid. Top and right-hand panels show the distribution in redshift and luminosity, respectively. The histograms represent the data, while the black lines are the model estimation.
Current usage metrics show cumulative count of Article Views (full-text article views including HTML views, PDF and ePub downloads, according to the available data) and Abstracts Views on Vision4Press platform.
Data correspond to usage on the plateform after 2015. The current usage metrics is available 48-96 hours after online publication and is updated daily on week days.
Initial download of the metrics may take a while.