Fig. 3
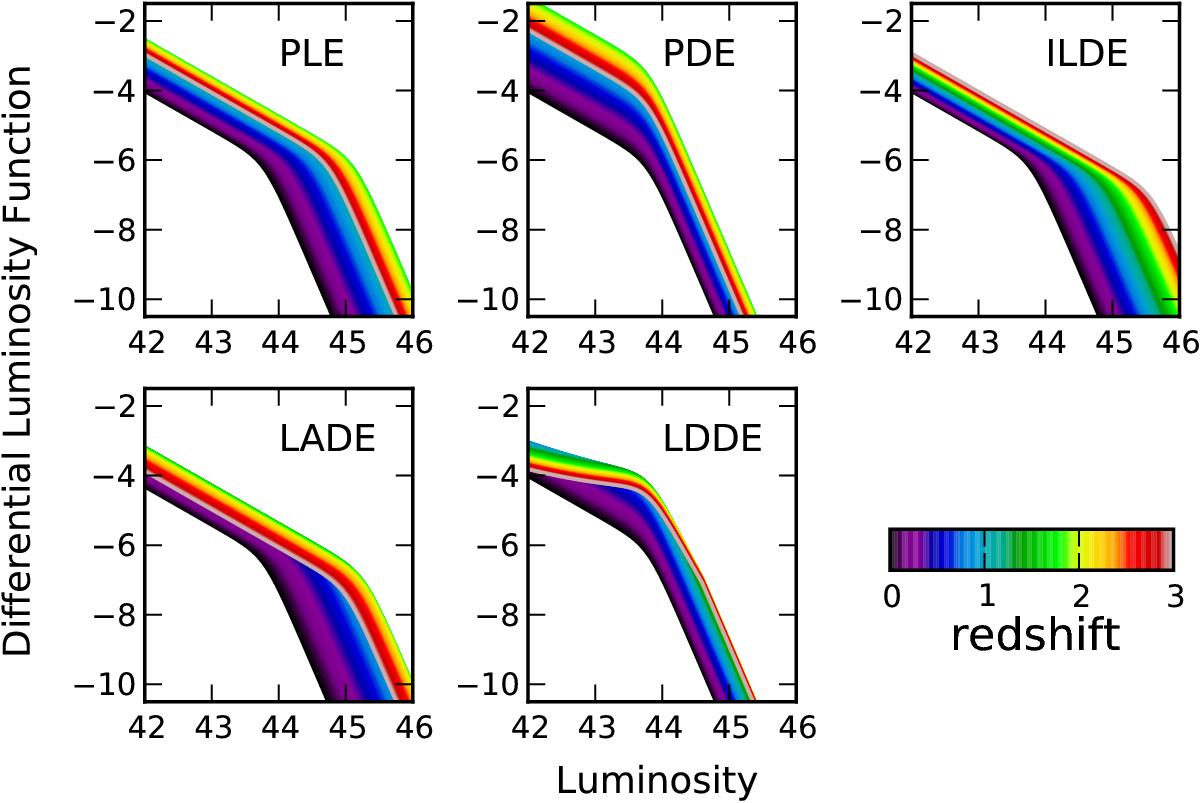
Comparison of common AGN luminosity function evolutionary models. Models computed with fictitious evolutionary parameters to demonstrate the qualitative difference in evolution. The color scale shows the evolution of each model with redshift ranging from z = 0 (black) to z = 3 (red). The critical redshift is chosen zc = 1.8 (bright green) for all models.
Current usage metrics show cumulative count of Article Views (full-text article views including HTML views, PDF and ePub downloads, according to the available data) and Abstracts Views on Vision4Press platform.
Data correspond to usage on the plateform after 2015. The current usage metrics is available 48-96 hours after online publication and is updated daily on week days.
Initial download of the metrics may take a while.