Fig. 4
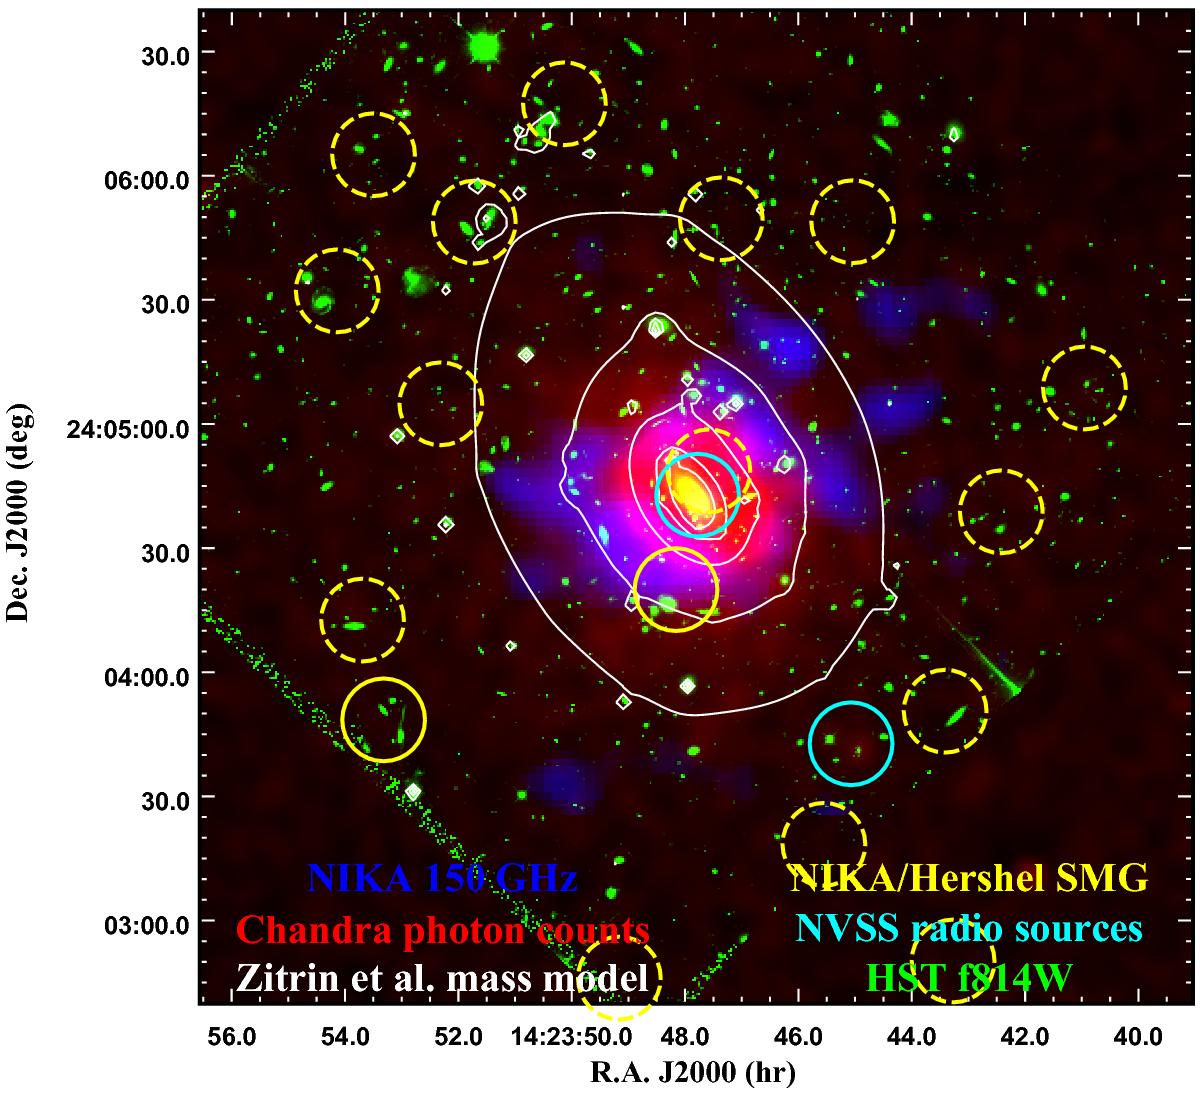
Composite multiwavelength overview image of MACS J1423.8+2404. Blue image: NIKA 150 GHz map showing the tSZ signal. Red image: Chandra photon counts (Obs-ID 04195) tracing the electronic density. White contours: Surface mass distribution model obtained by Zitrin et al. (2011, 2015) on a linear scale. Yellow circles: (Sub-)millimeter sources candidate locations obtained using the NIKA 260 GHz map (solid line) and identified using Herschel (dashed-line). Cyan circle: Location of the radio point sources present in the field as obtained from VLA (LaRoque et al. 2003). Green image: Hubble Space Telescope image using the F814W filter obtained by the CLASH program (Postman et al. 2012) showing the location of the galaxies.
Current usage metrics show cumulative count of Article Views (full-text article views including HTML views, PDF and ePub downloads, according to the available data) and Abstracts Views on Vision4Press platform.
Data correspond to usage on the plateform after 2015. The current usage metrics is available 48-96 hours after online publication and is updated daily on week days.
Initial download of the metrics may take a while.