Free Access
Fig. 3
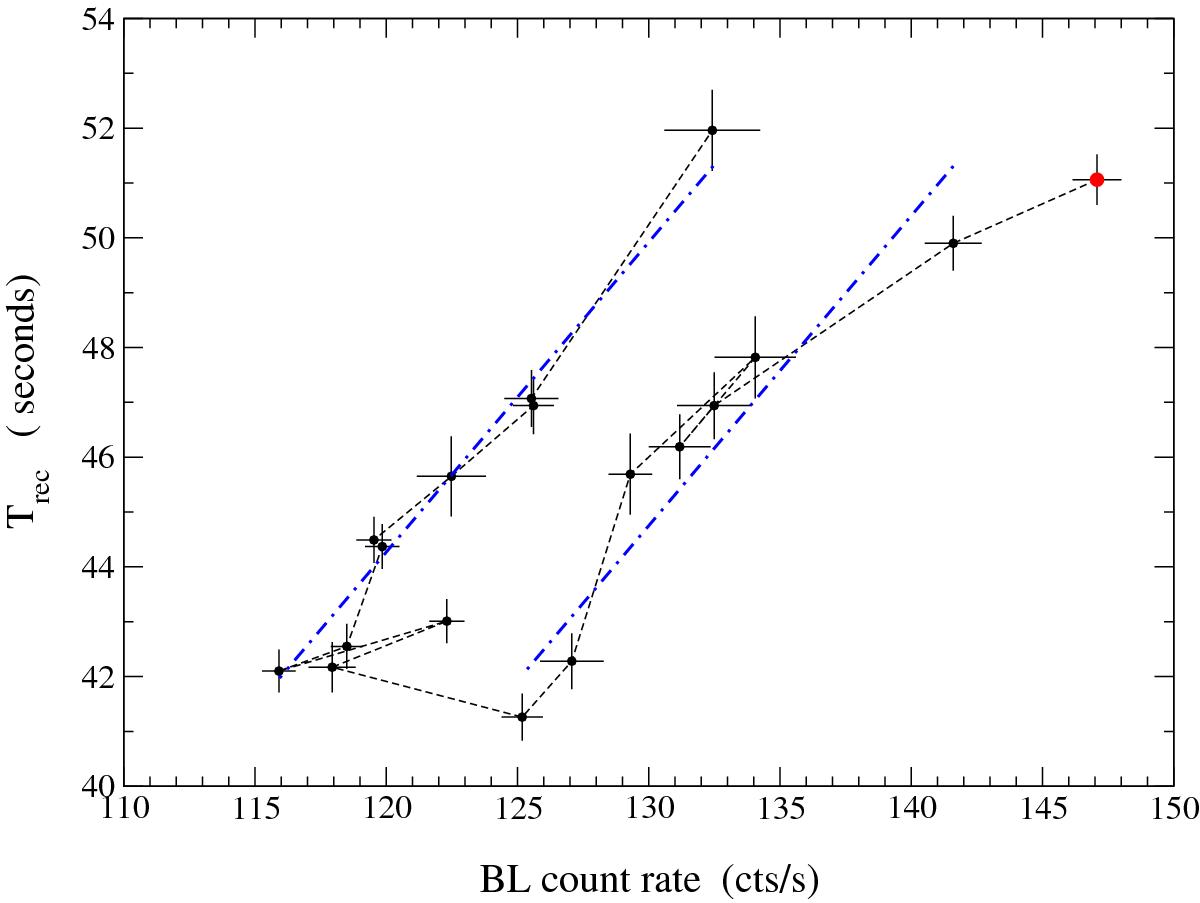
Trec vs. the BL rate during the April 1999 observation. The dot-dashed blue lines are the linear best fits to the data of the two branches with the same slope. The initial point is marked by a red circle. The dotted lines connecting the points describe the time sequence of data.
Current usage metrics show cumulative count of Article Views (full-text article views including HTML views, PDF and ePub downloads, according to the available data) and Abstracts Views on Vision4Press platform.
Data correspond to usage on the plateform after 2015. The current usage metrics is available 48-96 hours after online publication and is updated daily on week days.
Initial download of the metrics may take a while.