Free Access
Fig. 1
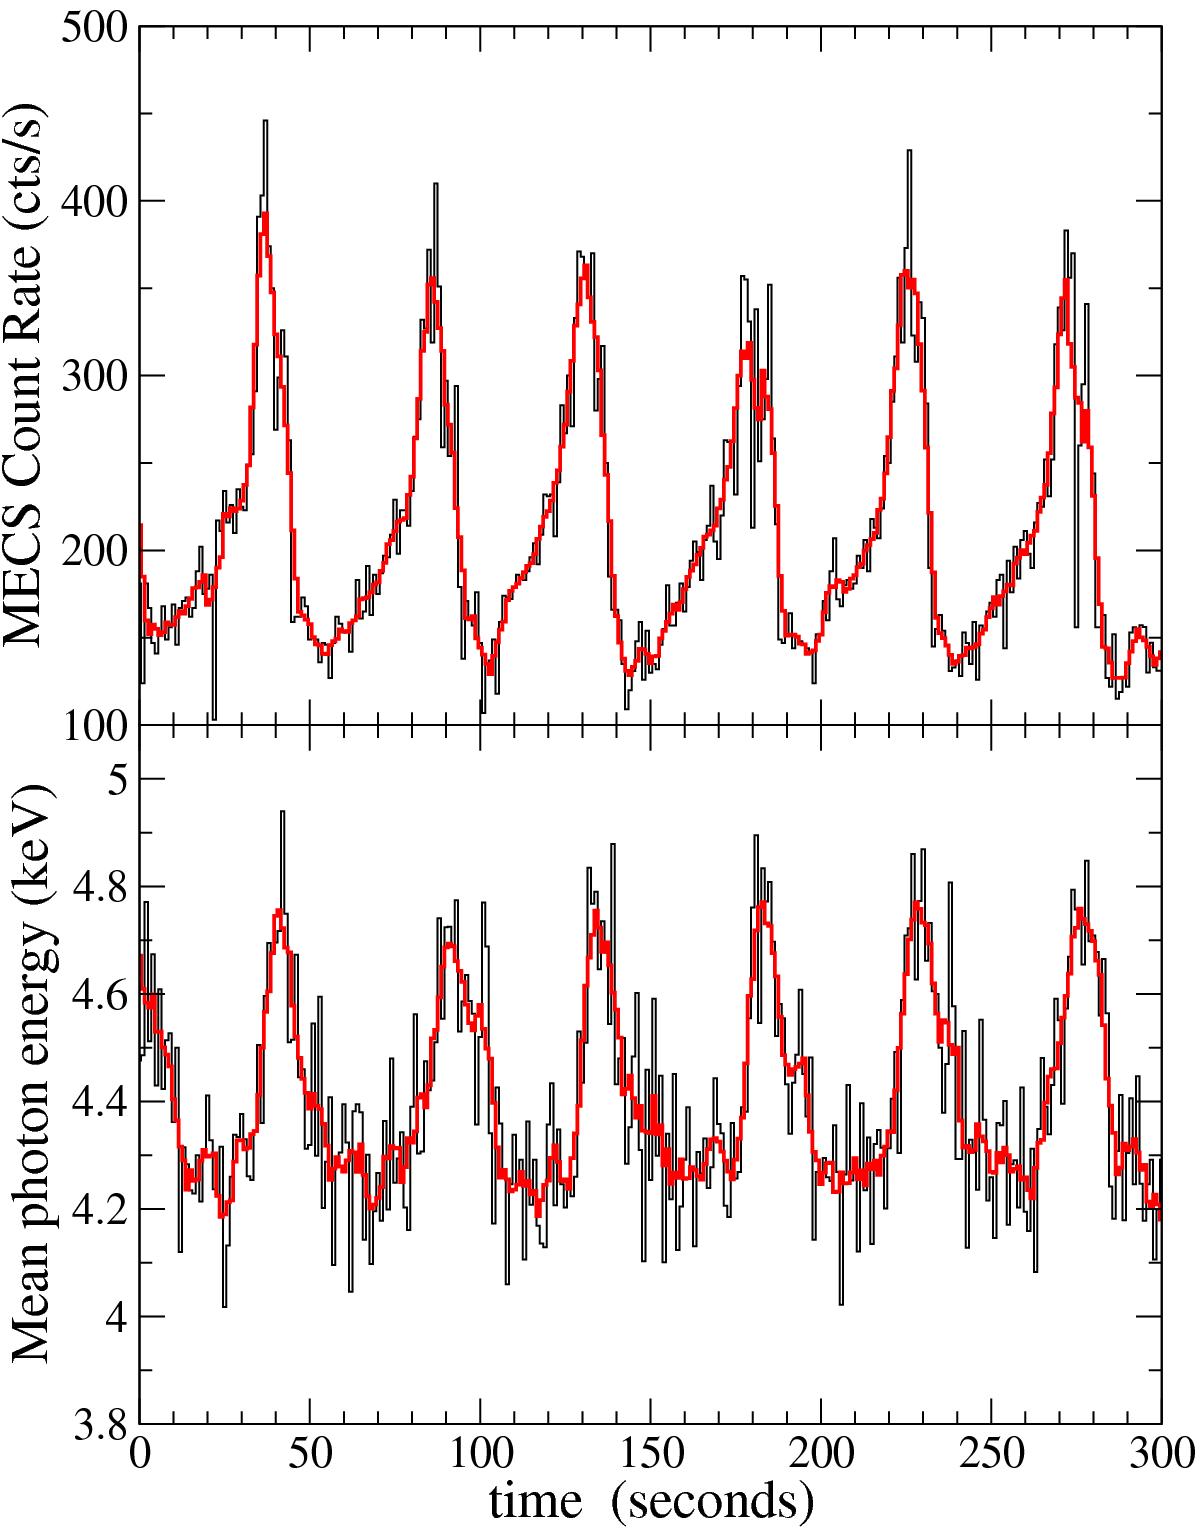
Time evolution of the series P3b. The top panel shows a short portion of the light curve in the entire MECS energy range; the bottom panel presents the relative mean energy. Black curves are the rates with 1 s integration time, while red curves are averaged in a 5 s interval.
Current usage metrics show cumulative count of Article Views (full-text article views including HTML views, PDF and ePub downloads, according to the available data) and Abstracts Views on Vision4Press platform.
Data correspond to usage on the plateform after 2015. The current usage metrics is available 48-96 hours after online publication and is updated daily on week days.
Initial download of the metrics may take a while.