Fig. 6
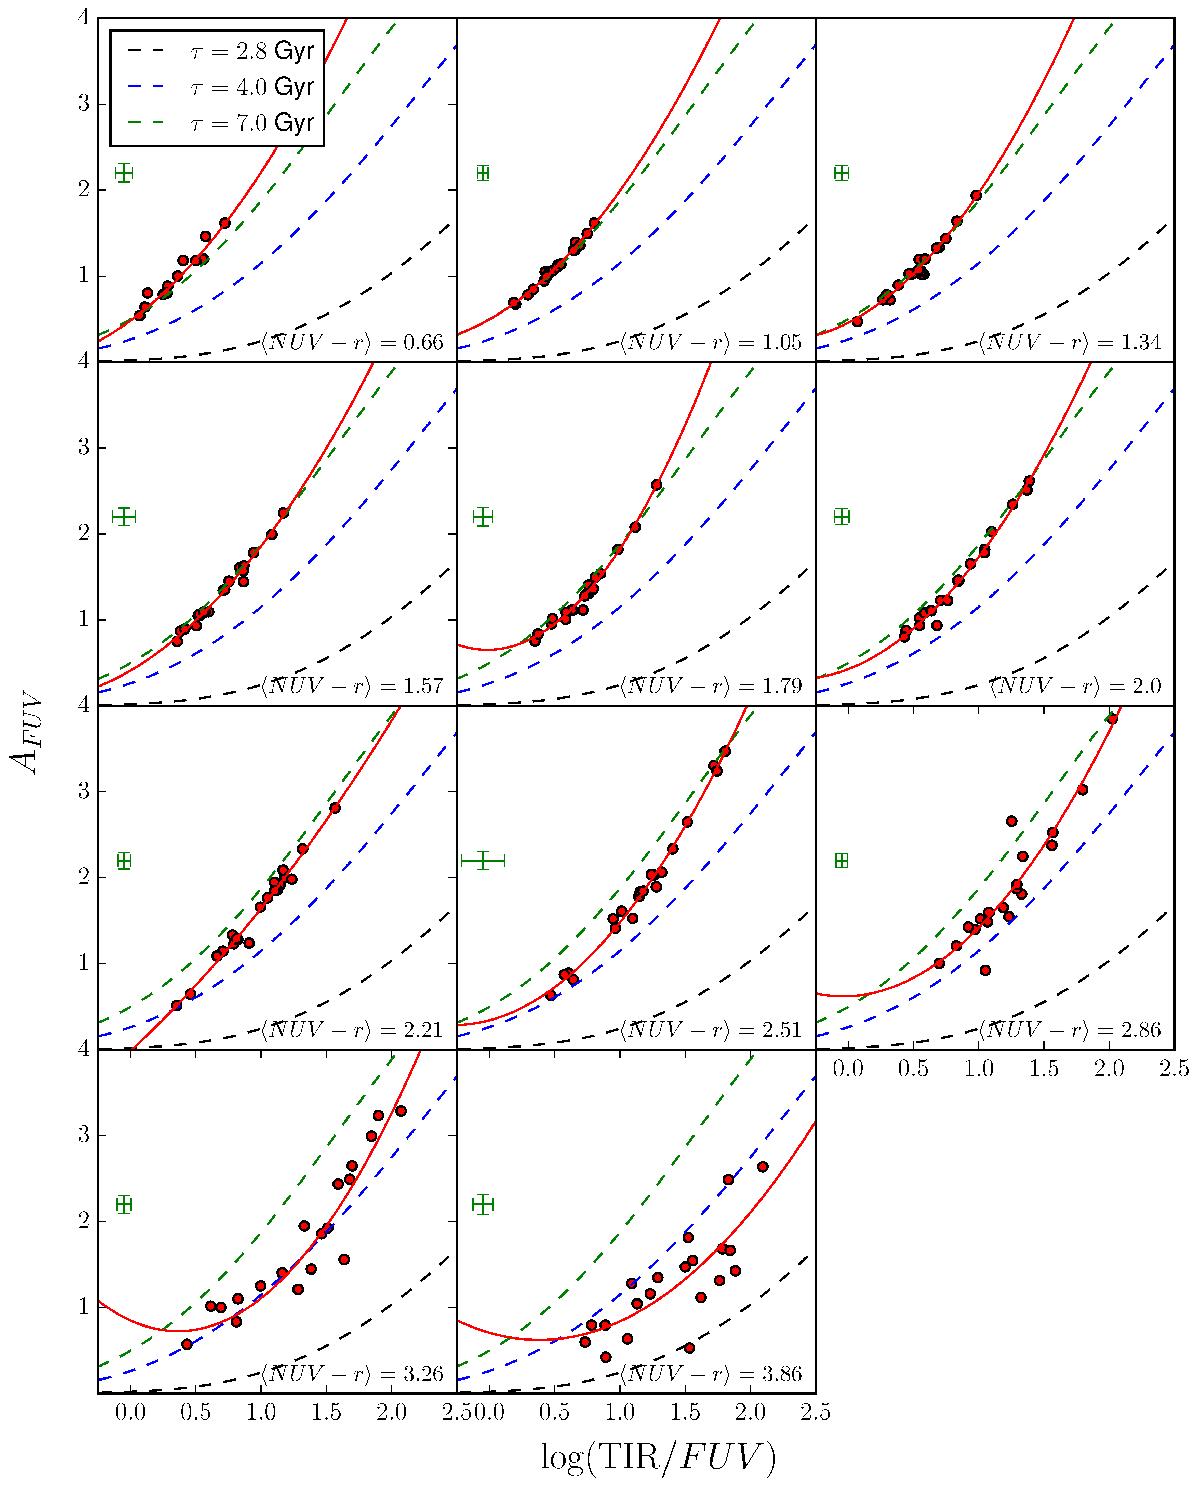
AFUV vs. log (TIR /FUV) relation separated in different bins of NUV − r colour. The points in each bin are fitted with a second-degree polynomial (solid line). For comparison, a few relations from the calibration by C08 are plotted as dashed lines. Average error bars per bin are shown in green.
Current usage metrics show cumulative count of Article Views (full-text article views including HTML views, PDF and ePub downloads, according to the available data) and Abstracts Views on Vision4Press platform.
Data correspond to usage on the plateform after 2015. The current usage metrics is available 48-96 hours after online publication and is updated daily on week days.
Initial download of the metrics may take a while.