Fig. 4
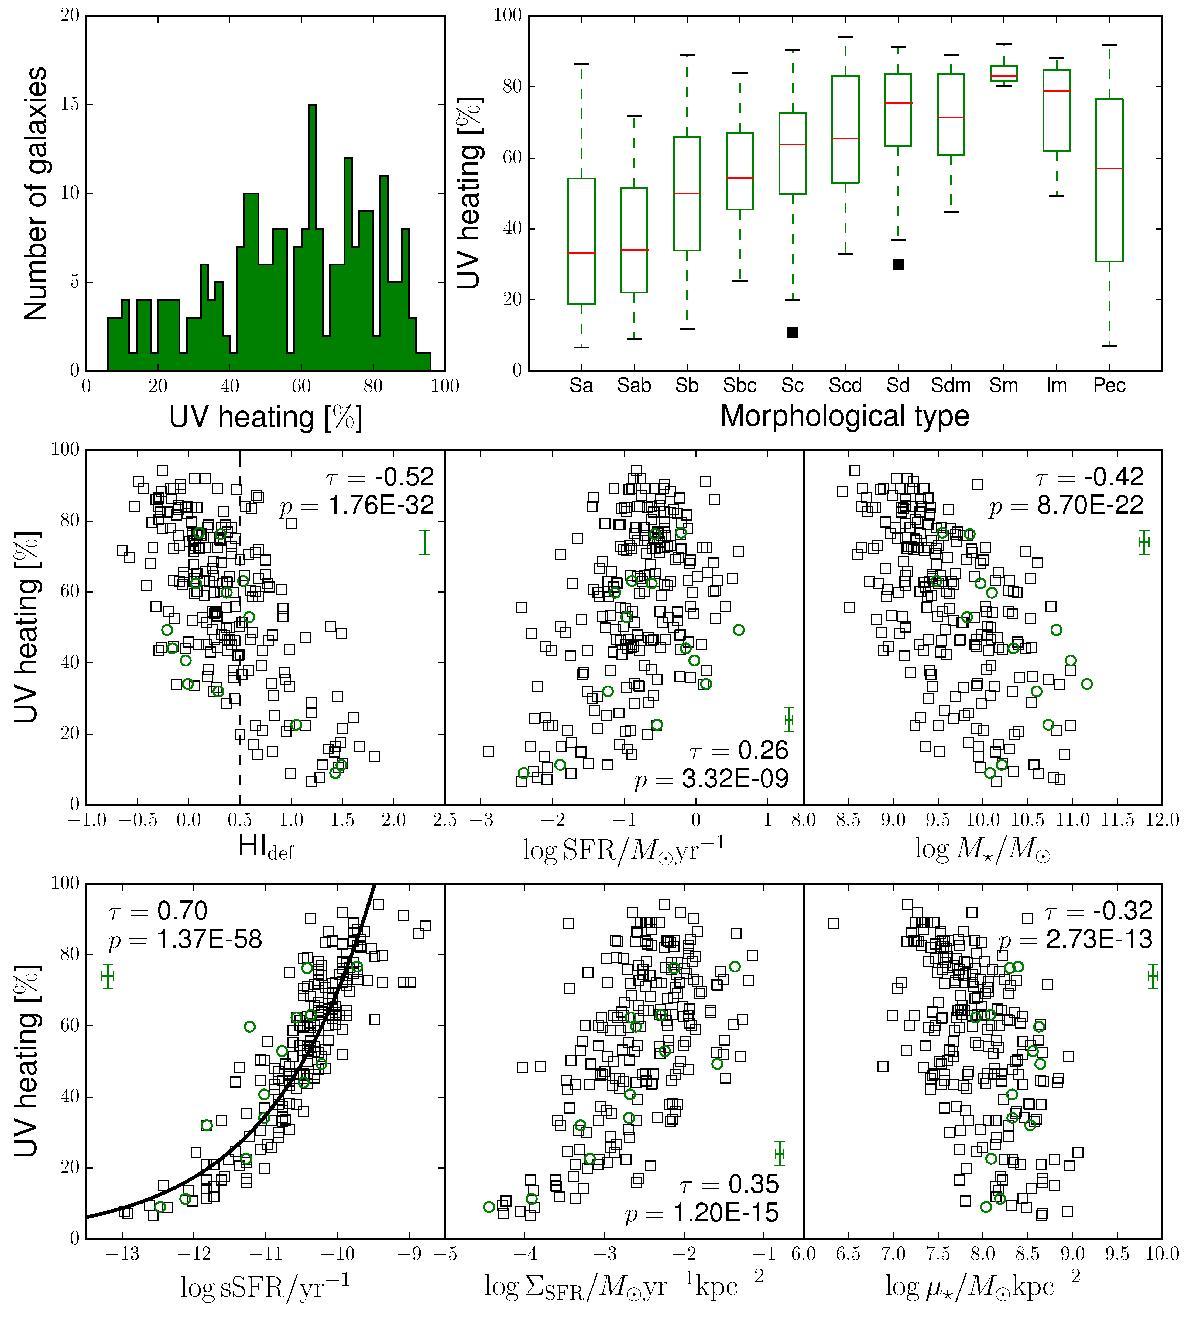
Top left: histogram of the UV heating fraction ξUV for the galaxies in the sample. Top right: box plots of ξUV for different morphological types. Red lines indicate the median values, boxes the 1st and 3rd quantiles. Outliers are plotted as black squares. Middle row: correlations between the UV heating and HI deficiency, SFR, and stellar mass. Bottom row: correlations between the UV heating and sSFR and between the SFR surface density and stellar mass surface density. Green circles are classified as strong AGNs. The Kendall τ correlation coefficients and corresponding p-values are indicated for each scatter plot. Average error bars are shown in green.
Current usage metrics show cumulative count of Article Views (full-text article views including HTML views, PDF and ePub downloads, according to the available data) and Abstracts Views on Vision4Press platform.
Data correspond to usage on the plateform after 2015. The current usage metrics is available 48-96 hours after online publication and is updated daily on week days.
Initial download of the metrics may take a while.