Fig. 9
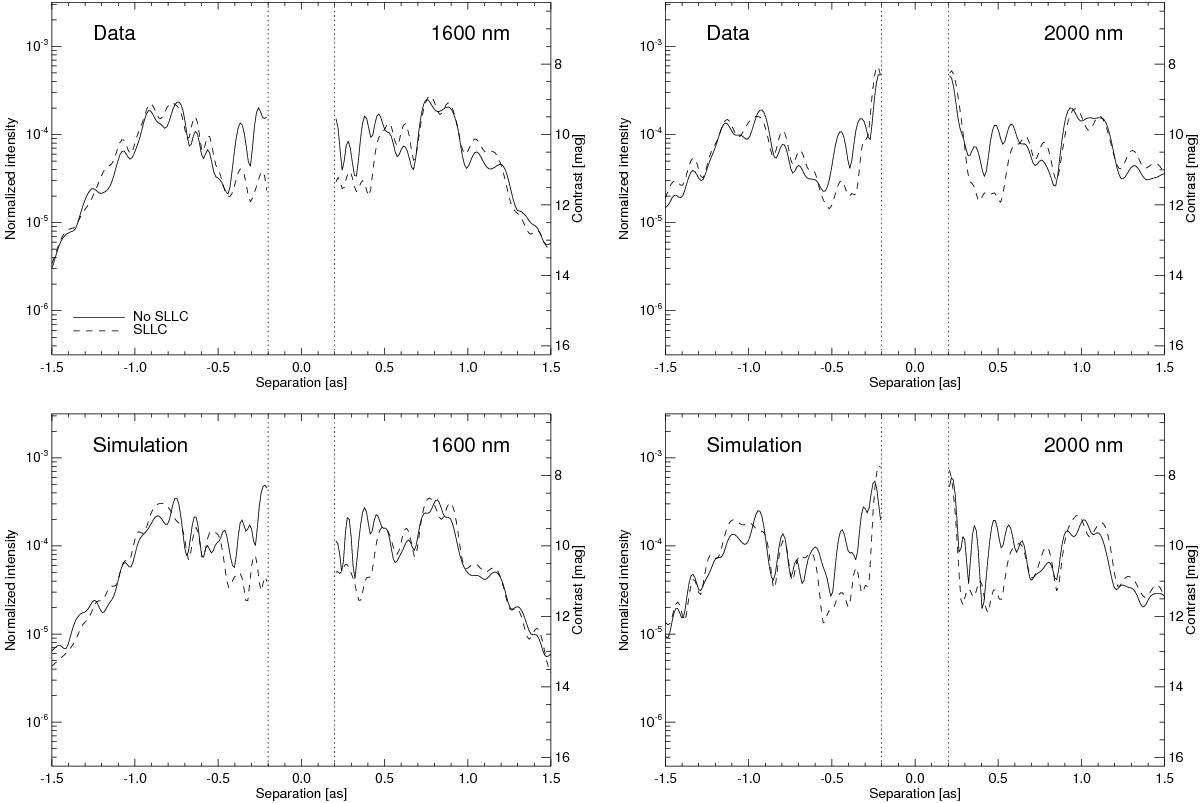
IRDIS/LSS coronagraphic intensity profiles with (dashed line) and without (plain line) the SLLC as a function of angular separation on both sides of the optical axis and normalized with respect to an off-axis PSF. Profiles are plotted at two wavelengths, 1600 nm and 2000 nm. The top panel presents the data acquired in SPHERE and the bottom panel the simulations performed at the same wavelengths with our SPHERE simulation model including all error terms. The central part between −0.2′′ and 0.2′′ without any data corresponds to the location of the FPM inside the slit.
Current usage metrics show cumulative count of Article Views (full-text article views including HTML views, PDF and ePub downloads, according to the available data) and Abstracts Views on Vision4Press platform.
Data correspond to usage on the plateform after 2015. The current usage metrics is available 48-96 hours after online publication and is updated daily on week days.
Initial download of the metrics may take a while.