Fig. 8
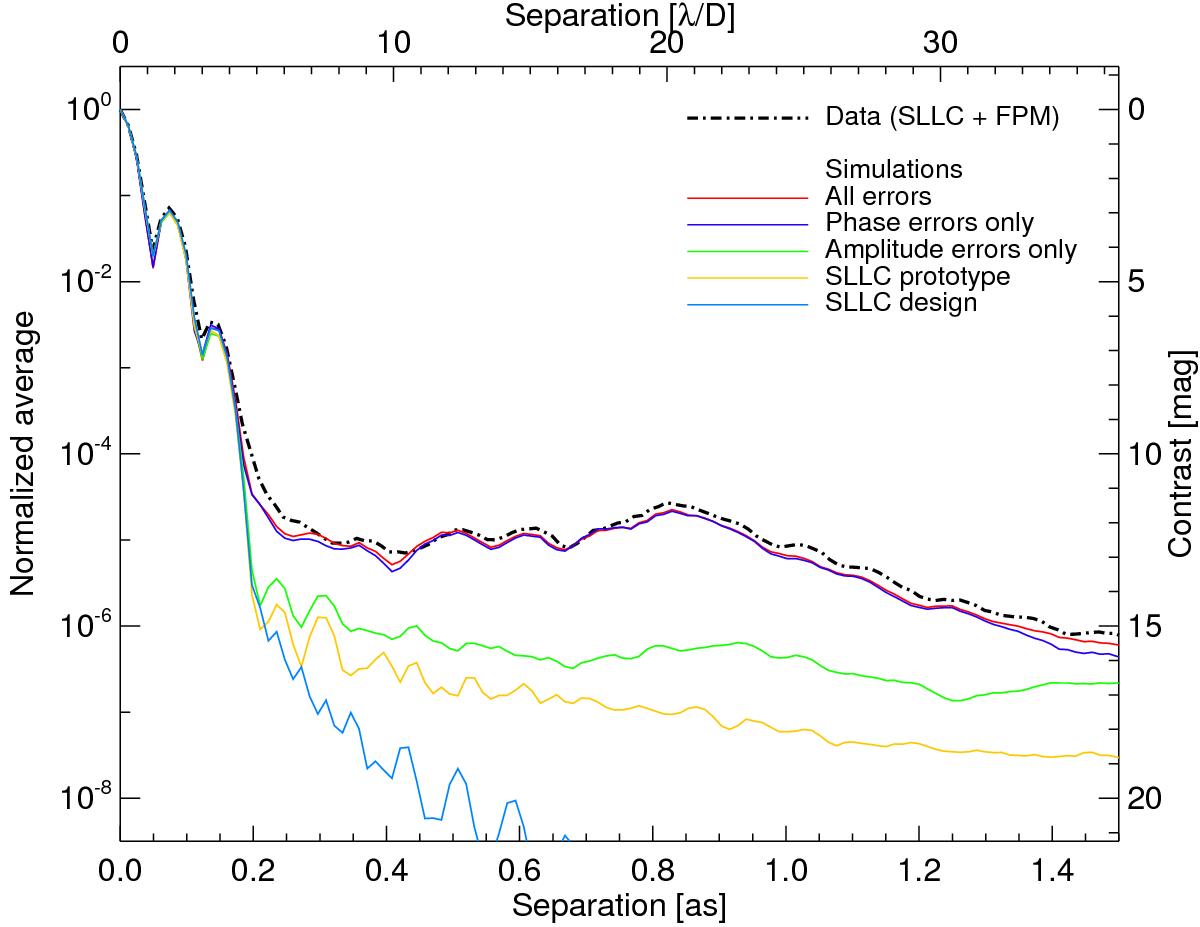
Normalized azimuthal average for different simulations in the H2 filter (1593 nm) with the SLLC and taking into account various error terms: all sources of errors (red), only phase errors (dark blue), only amplitude errors (green), only the measured transmission map of the SLLC prototype (orange), and finally with only the SLLC nominal design (light blue). The SLLC+FPM data are overplotted as a black dash-dotted line.
Current usage metrics show cumulative count of Article Views (full-text article views including HTML views, PDF and ePub downloads, according to the available data) and Abstracts Views on Vision4Press platform.
Data correspond to usage on the plateform after 2015. The current usage metrics is available 48-96 hours after online publication and is updated daily on week days.
Initial download of the metrics may take a while.