Free Access
Fig. 7
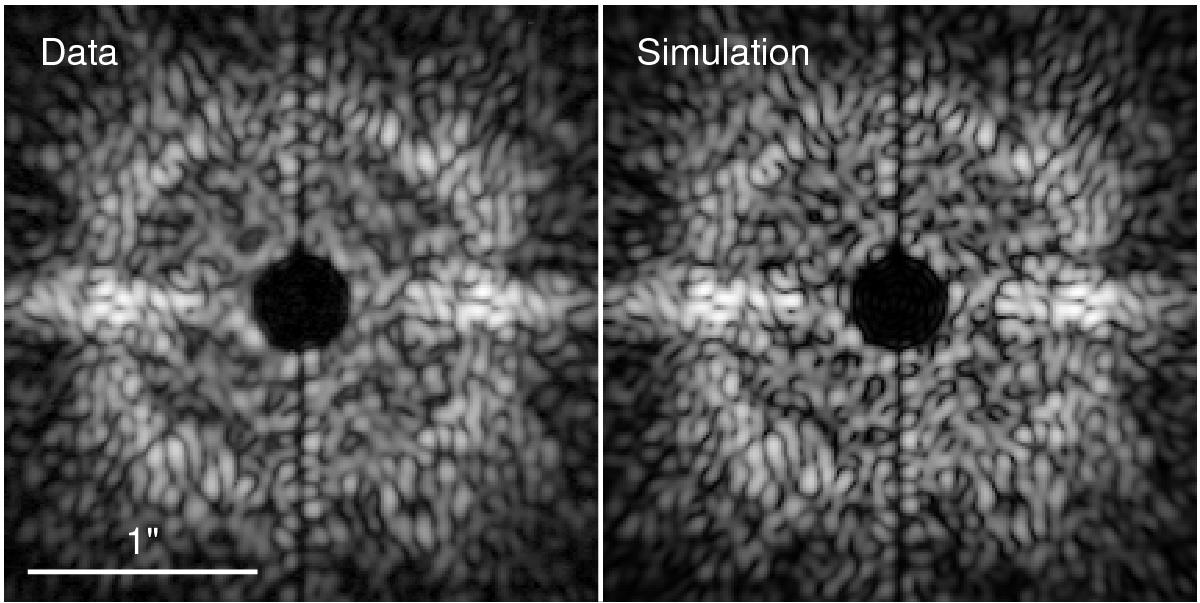
Comparison of SLLC+FPM imaging data acquired in the IRDIS H2 filter (left) with the output of our SPHERE simulation model (right). The vertical dark line at the center corresponds to the arms that hold the suspended FPM. The spatial extension is 2.6′′ on the side.
Current usage metrics show cumulative count of Article Views (full-text article views including HTML views, PDF and ePub downloads, according to the available data) and Abstracts Views on Vision4Press platform.
Data correspond to usage on the plateform after 2015. The current usage metrics is available 48-96 hours after online publication and is updated daily on week days.
Initial download of the metrics may take a while.