Fig. 5
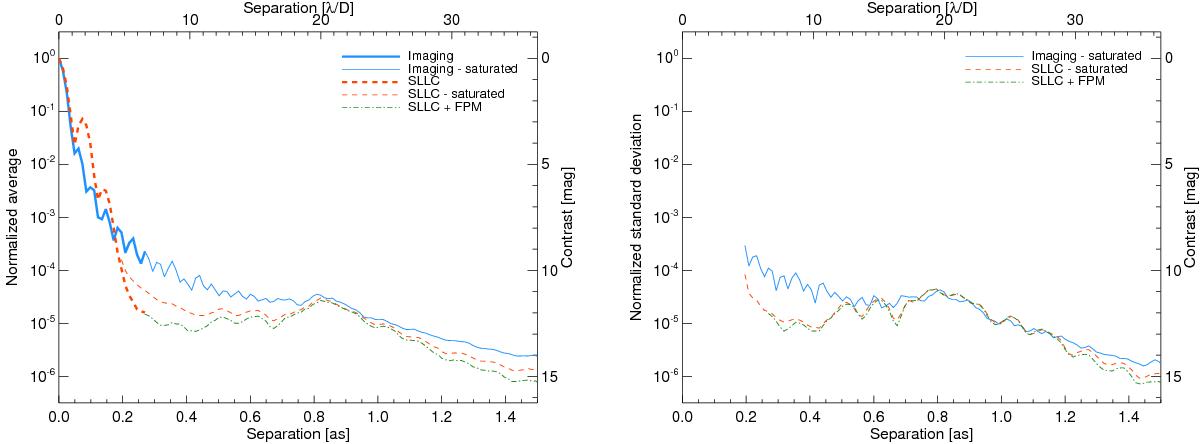
Normalized azimuthal average (left) and standard deviation (right) profiles as a function of angular separation for the imaging data (blue), the SLLC data (red), and the SLLC+FPM data (green) at 1593 nm. The saturated and unsaturated data overlap in the 0.20–0.25′′ range. The data with the FPM plane mask is also plotted starting at 0.25′′. For the standard deviation, only the values measured on the saturated data are plotted.
Current usage metrics show cumulative count of Article Views (full-text article views including HTML views, PDF and ePub downloads, according to the available data) and Abstracts Views on Vision4Press platform.
Data correspond to usage on the plateform after 2015. The current usage metrics is available 48-96 hours after online publication and is updated daily on week days.
Initial download of the metrics may take a while.