Fig. 4
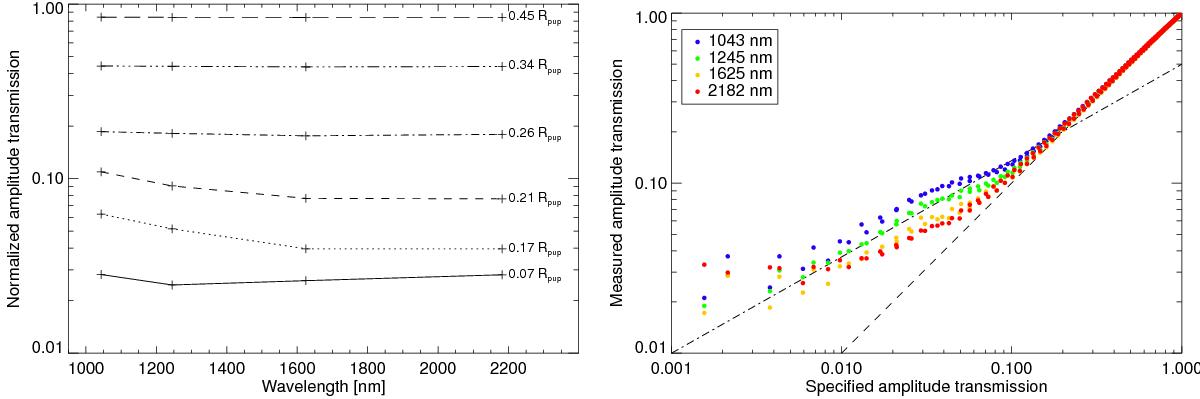
Chromaticity of the amplitude transmission of the aluminum prototype. Left: normalized amplitude transmission as a function of wavelength at different radii in the pupil (dotted vertical lines in Fig. 3), for which the value is indicated on the right side of each curve. Right: measured amplitude transmission at the four wavelengths as a function of the original specification. The dashed and dash-dotted lines show the 1 decade/decade and 0.5 decade/decade trends.
Current usage metrics show cumulative count of Article Views (full-text article views including HTML views, PDF and ePub downloads, according to the available data) and Abstracts Views on Vision4Press platform.
Data correspond to usage on the plateform after 2015. The current usage metrics is available 48-96 hours after online publication and is updated daily on week days.
Initial download of the metrics may take a while.