Fig. 3
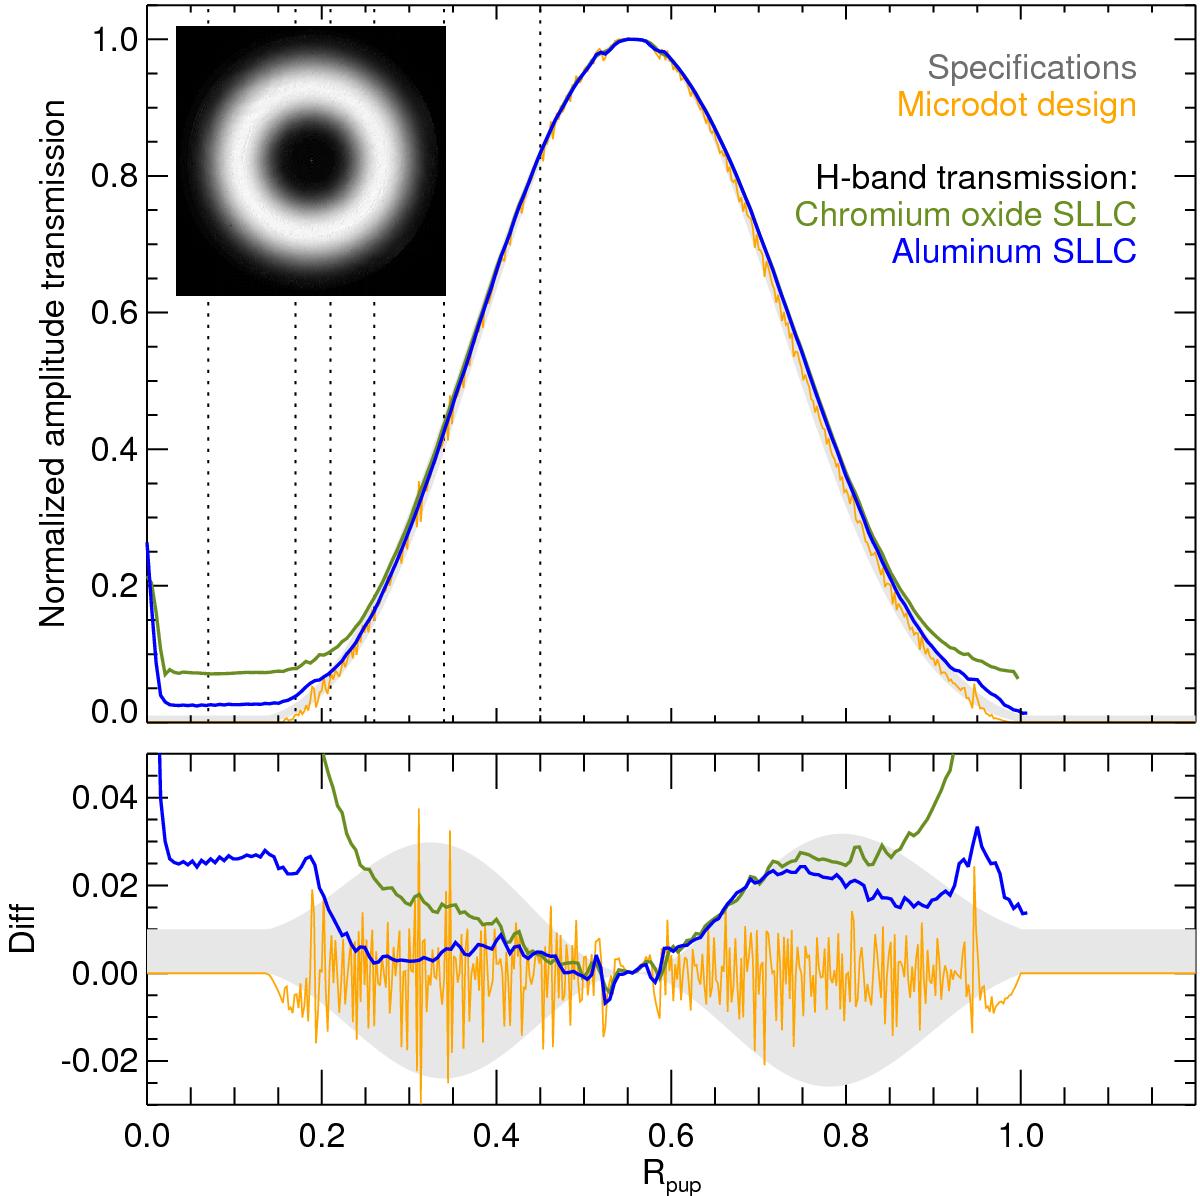
Azimuthal average of the amplitude transmission in H band for the chromium oxide (green) and aluminum (blue) SLLC prototypes as a function of the normalized distance from the apodizer center (Rpup). The increase in transmission close to zero corresponds to the pattern introduced in the design to facilitate the opto-mechanical centering of the apodizer. The design specifications are represented by a gray envelope. The transmission of the microdots map designed by Aktiwave is also plotted in orange. This profile appears noisier because the microdots map is binarized. The top plot shows the normalized transmission measurement, and the bottom plot shows the error with respect to the nominal transmission profile. The vertical dotted lines correspond to the radii where we plot the transmission as a function of wavelength in the left panel of Fig. 4. The transmission map of the aluminum prototype in H band is shown as an inset in the top left corner of the plot.
Current usage metrics show cumulative count of Article Views (full-text article views including HTML views, PDF and ePub downloads, according to the available data) and Abstracts Views on Vision4Press platform.
Data correspond to usage on the plateform after 2015. The current usage metrics is available 48-96 hours after online publication and is updated daily on week days.
Initial download of the metrics may take a while.