Fig. 10
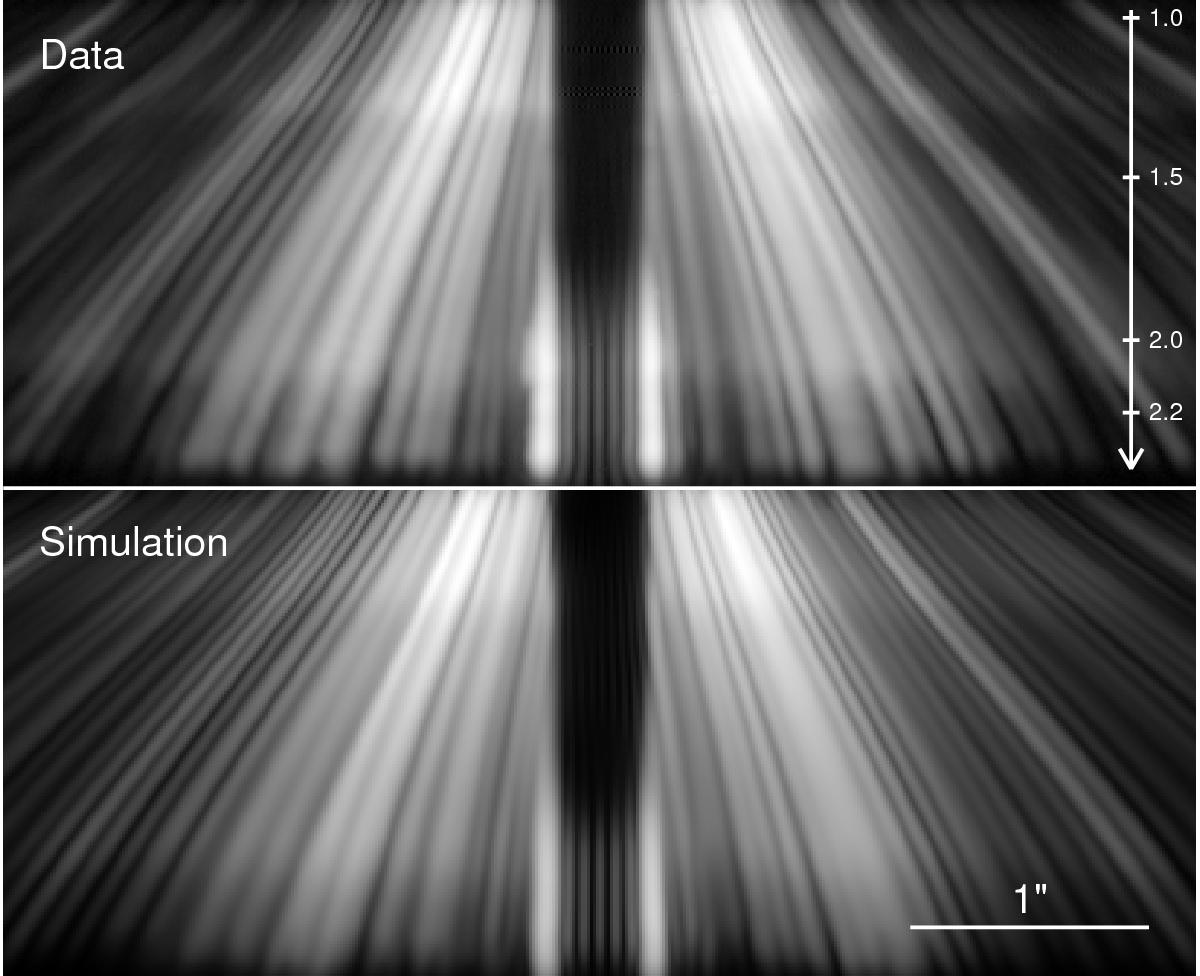
IRDIS/LSS data acquired with the SLLC (top) compared to the output of our SPHERE simulation model (bottom). The dark band at the center corresponds to the location of the FPM inside the slit. The wavelength scale (in micron) is indicated with the downward white arrow. The total spectral range is 0.95–2.3 μm, and the spatial extension is 2.5′′.
Current usage metrics show cumulative count of Article Views (full-text article views including HTML views, PDF and ePub downloads, according to the available data) and Abstracts Views on Vision4Press platform.
Data correspond to usage on the plateform after 2015. The current usage metrics is available 48-96 hours after online publication and is updated daily on week days.
Initial download of the metrics may take a while.