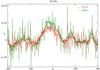
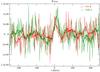
Fig. 2
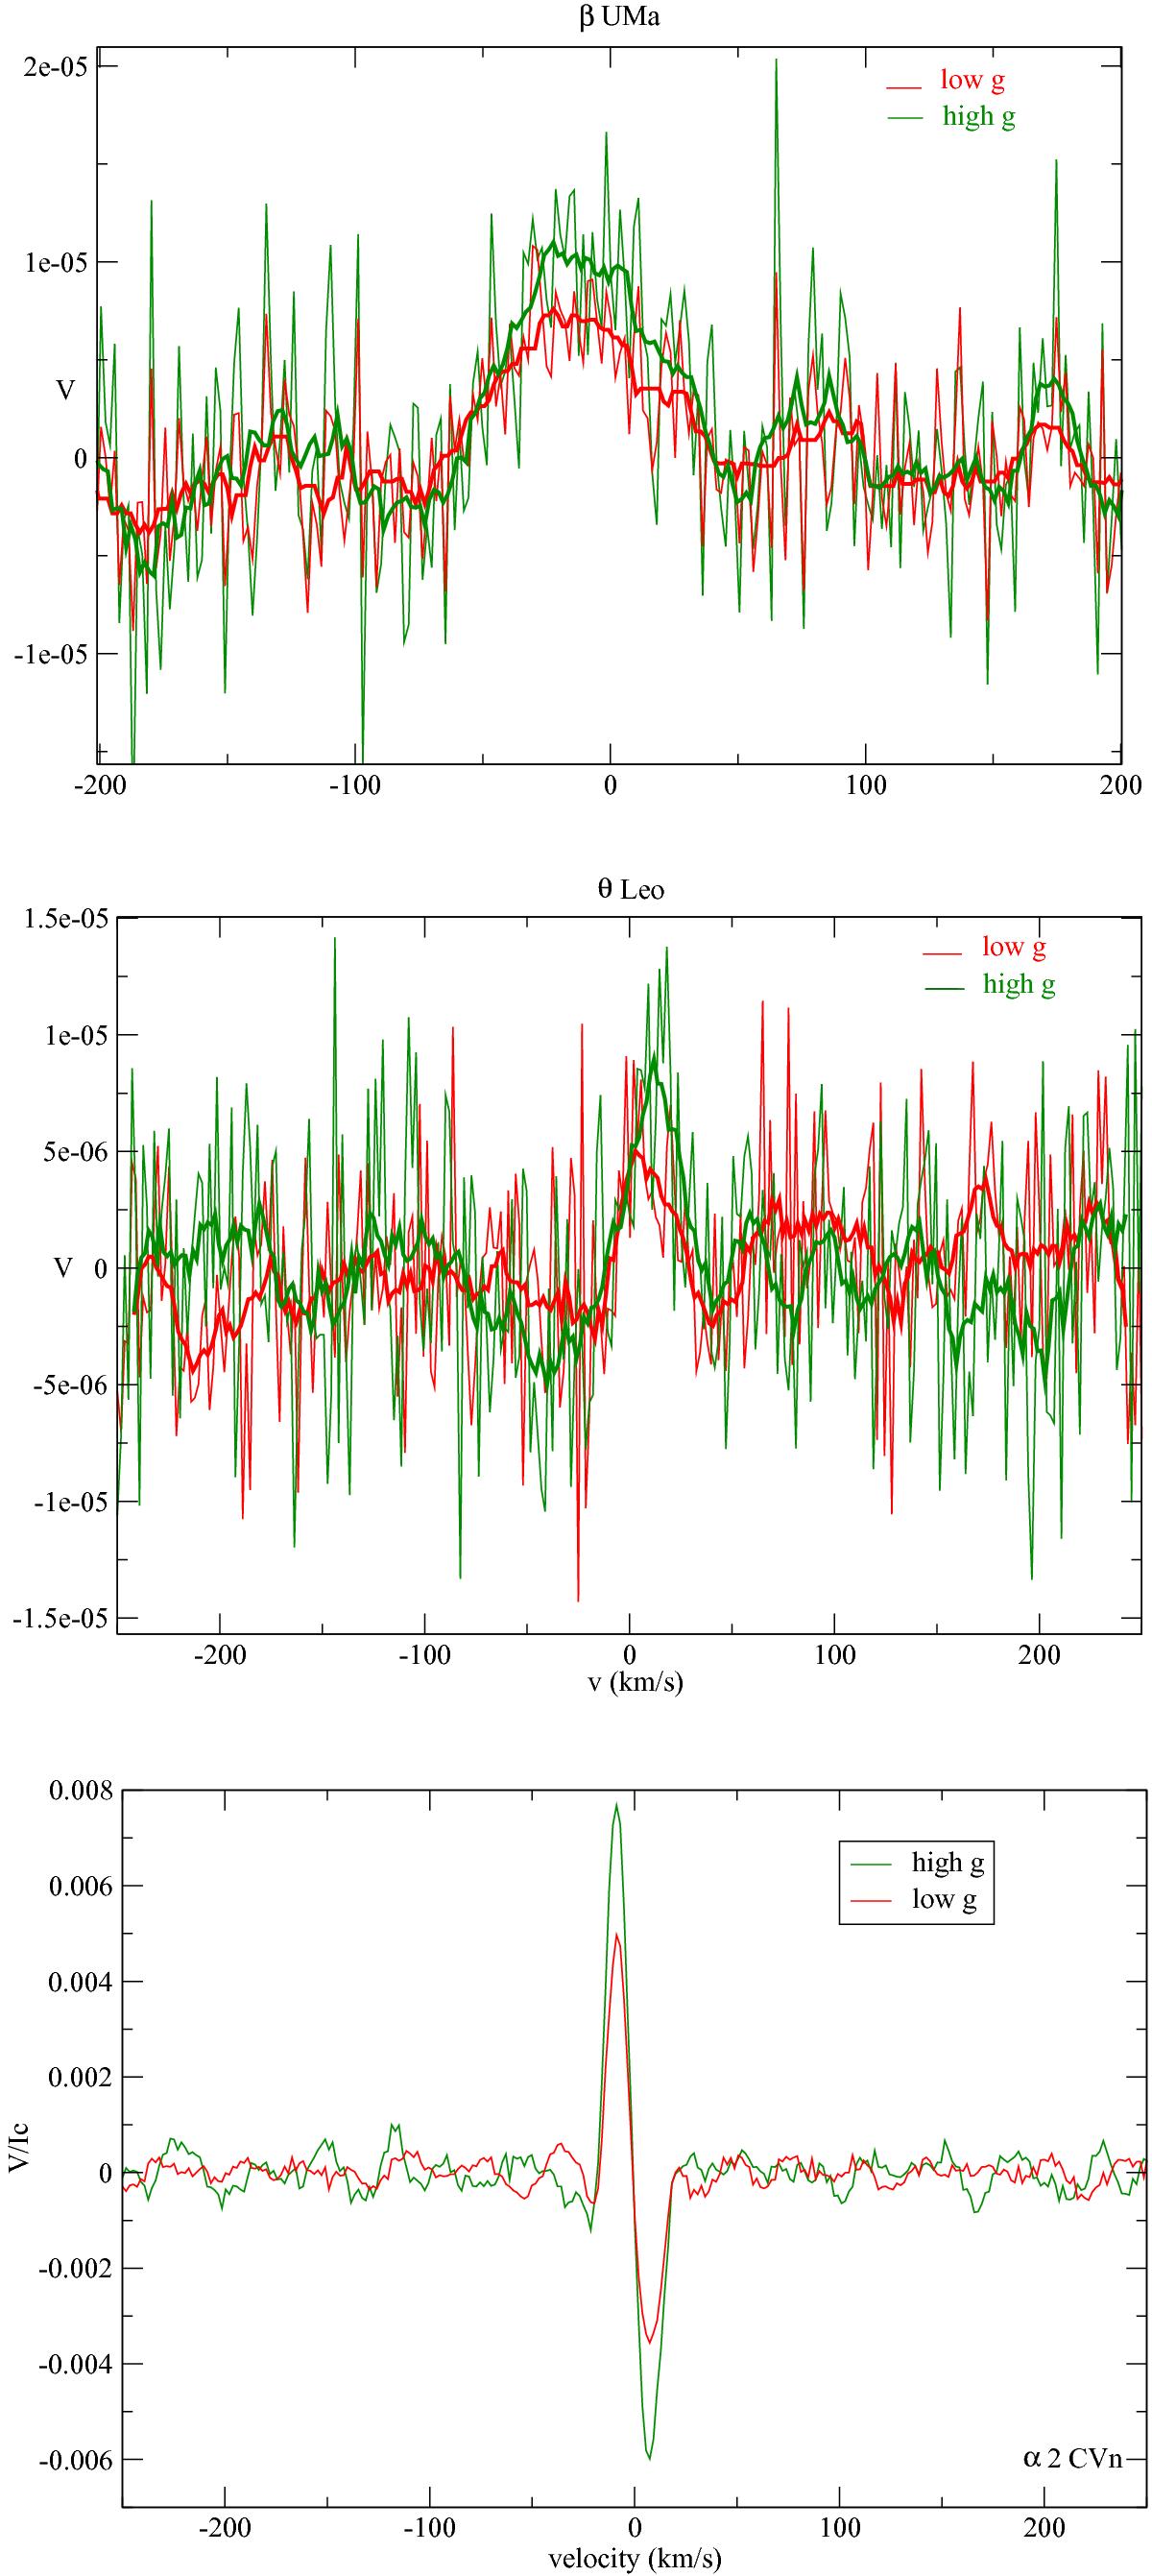
Top: comparison of the Stokes V profiles obtained by selecting photospheric lines of low (red thin line) and high (green thin line) magnetic sensitivity for β UMa. The thick red and green lines represent a moving average over three spectral bins of the thin lines. Center: same figure for θ Leo. Bottom: same for α2 CVn. All profiles are normalized to the continuum level.
Current usage metrics show cumulative count of Article Views (full-text article views including HTML views, PDF and ePub downloads, according to the available data) and Abstracts Views on Vision4Press platform.
Data correspond to usage on the plateform after 2015. The current usage metrics is available 48-96 hours after online publication and is updated daily on week days.
Initial download of the metrics may take a while.