Fig. 1
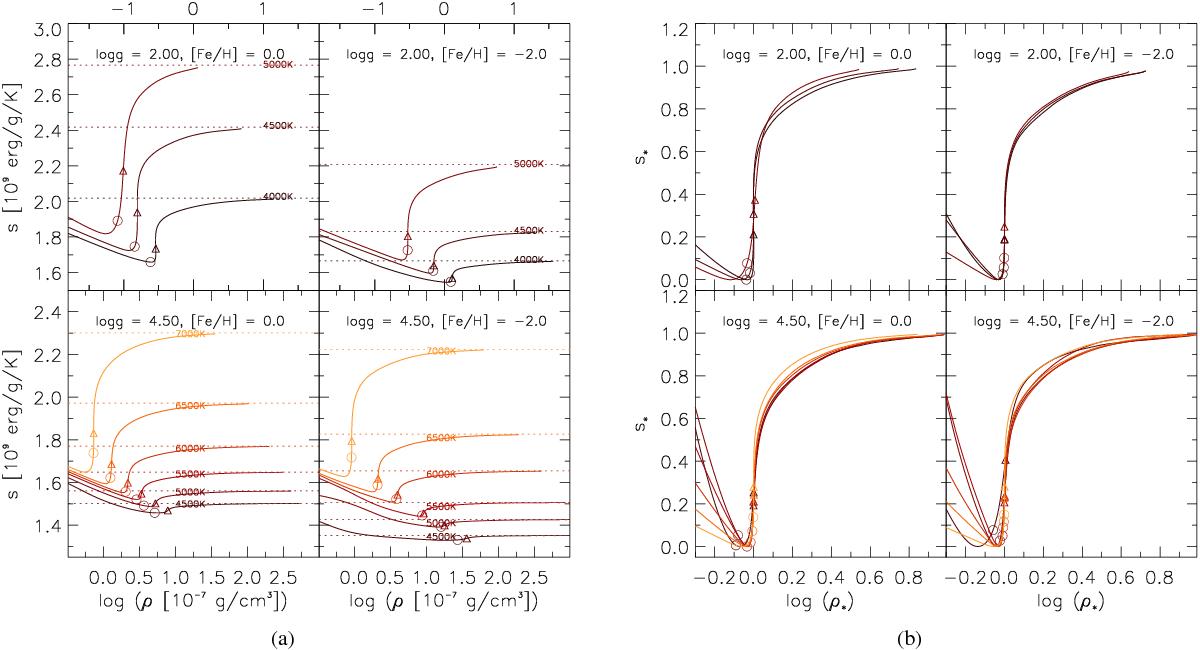
Entropy vs. density shown for different stellar parameters without and with normalization (a) and b), respectively). Each panel shows models with the same surface gravity, log g, and metallicity, [Fe/H], but different effective temperature, Teff (orange/brown lines). Furthermore, the location of the optical surface, τRoss = 1, and maximum in the entropy gradient, ds | max, are indicated (circle and triangle, respectively). In the left figure, the adiabatic entropy, sad, values are also shown (horizontal dotted lines). We note the differences in the axes between the top and bottom panels in a).
Current usage metrics show cumulative count of Article Views (full-text article views including HTML views, PDF and ePub downloads, according to the available data) and Abstracts Views on Vision4Press platform.
Data correspond to usage on the plateform after 2015. The current usage metrics is available 48-96 hours after online publication and is updated daily on week days.
Initial download of the metrics may take a while.