Fig. 4
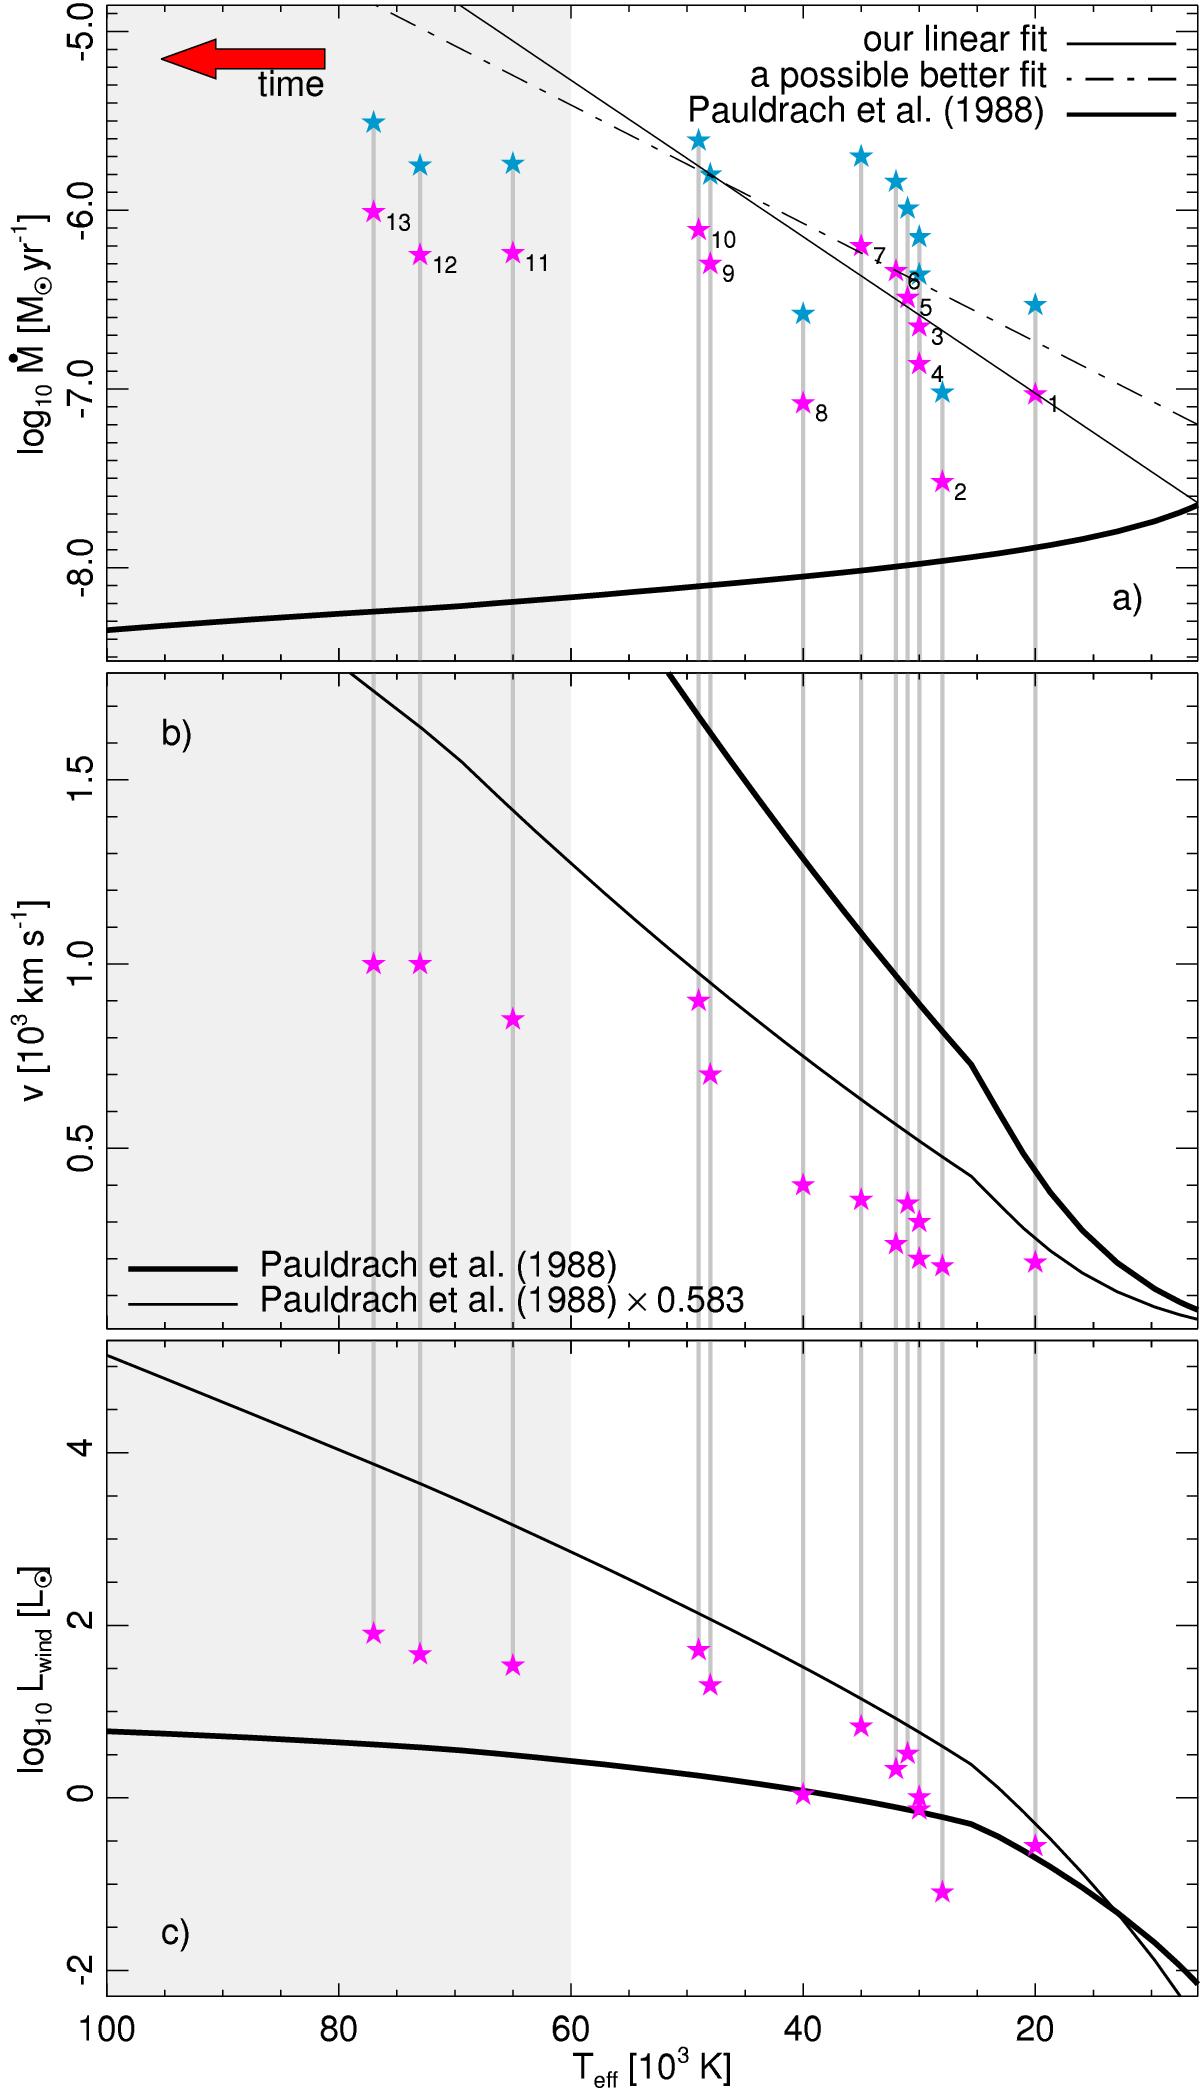
Models, scaled models, and empirical values of fast winds of PNe: a) the mass-loss rate Ṁ; b) the outflow velocity v; and c) the mechanical wind luminosity Lwind. Scaled values of Ṁ are illustrated with both magenta (![]() ) and blue (
) and blue (![]() ) star symbols. All symbols are indicated with both object (Table 4) and gray interconnecting lines for easy identification. Thick and thin lines indicate models based on Pauldrach et al. (1988) and actually used relations, respectively. The shaded part where Teff ≥ 60 000 K indicates regions where both the models and the used relations fit empirical values poorly.
) star symbols. All symbols are indicated with both object (Table 4) and gray interconnecting lines for easy identification. Thick and thin lines indicate models based on Pauldrach et al. (1988) and actually used relations, respectively. The shaded part where Teff ≥ 60 000 K indicates regions where both the models and the used relations fit empirical values poorly.
Current usage metrics show cumulative count of Article Views (full-text article views including HTML views, PDF and ePub downloads, according to the available data) and Abstracts Views on Vision4Press platform.
Data correspond to usage on the plateform after 2015. The current usage metrics is available 48-96 hours after online publication and is updated daily on week days.
Initial download of the metrics may take a while.