Fig. 3
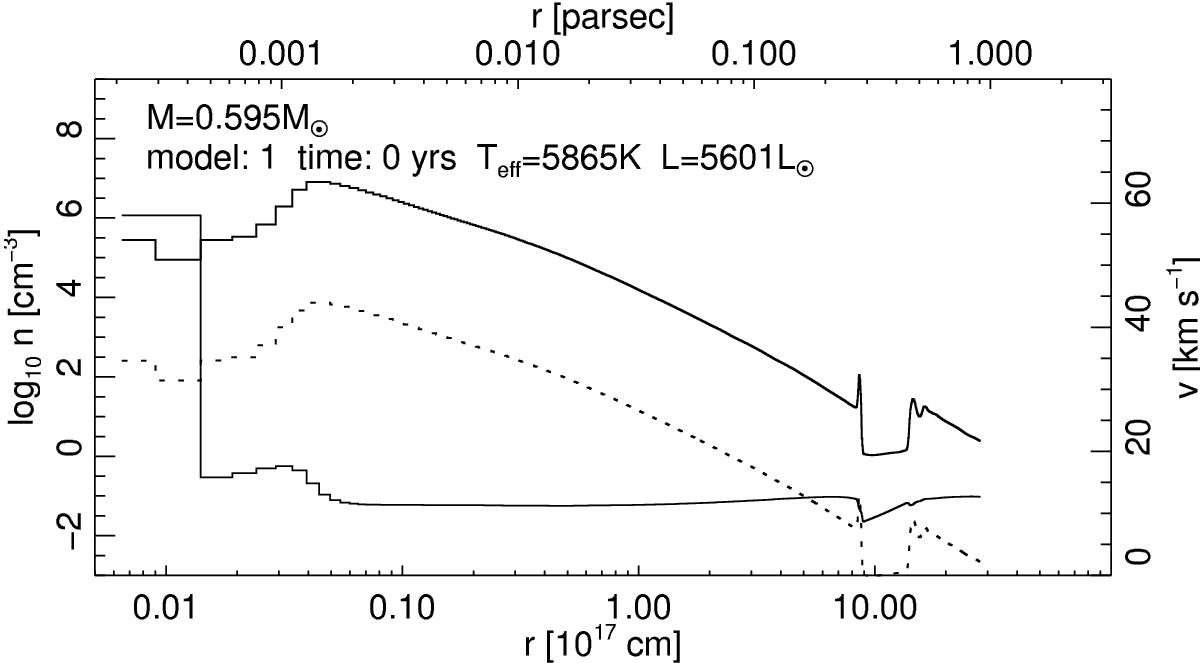
Initial AGB wind-envelope structures. The left-side axis is used with heavy particle (electron) densities drawn with a thick solid (dotted) line. The right-side axis is used with flow velocities drawn with a thin solid line. All properties are drawn as function of radius. All lines are drawn as histograms; individual gridpoints are visible in the innermost part of the envelope. The central-star mass is indicated in the panel. The large density trough at 1018cm is due to the last thermal pulse 40 000 yr before the star left the AGB.
Current usage metrics show cumulative count of Article Views (full-text article views including HTML views, PDF and ePub downloads, according to the available data) and Abstracts Views on Vision4Press platform.
Data correspond to usage on the plateform after 2015. The current usage metrics is available 48-96 hours after online publication and is updated daily on week days.
Initial download of the metrics may take a while.