Fig. 1
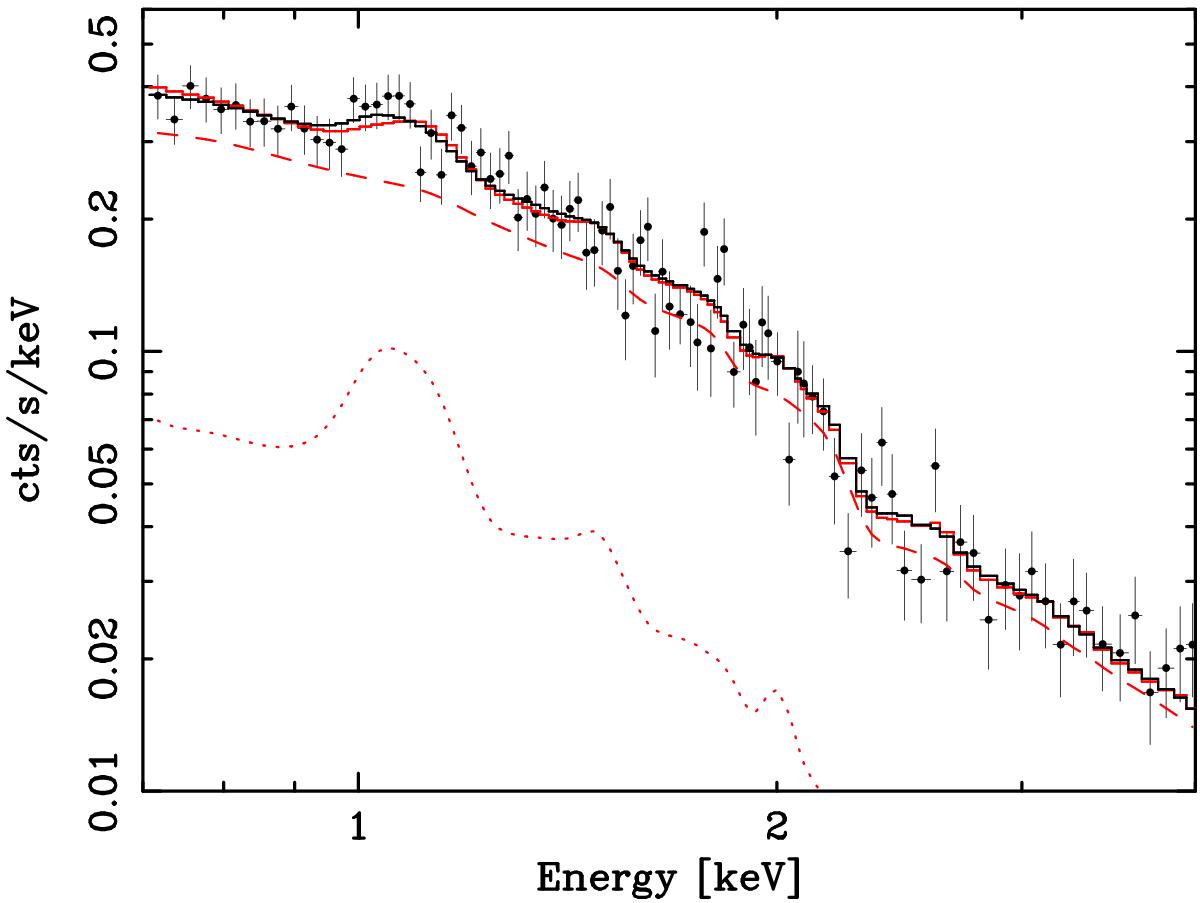
Simulated two-temperature spectrum and best fitting one-temperature model. The simulated spectrum and its components are plotted in red, the 1.8 keV and 3.6 keV components are shown as a dotted and dashed line, respectively, while the total spectrum is shown as a solid line. The best fitting one-temperature model is shown as a solid black line. Both the simulation and the fit were performed in a broad energy band, 0.5–10.0 keV; however, here we show only the 0.7–4.0 keV range. The one-temperature model does an adequate job of reproducing the shape of the L-shell blend arising from the two-temperature spectrum (for a more detailed discussion see text and Gastaldello et al. 2010). Given the didactic nature of this simulation, background components have not been included; these contributions will make attempts to discriminate between different spectral models even more arduous.
Current usage metrics show cumulative count of Article Views (full-text article views including HTML views, PDF and ePub downloads, according to the available data) and Abstracts Views on Vision4Press platform.
Data correspond to usage on the plateform after 2015. The current usage metrics is available 48-96 hours after online publication and is updated daily on week days.
Initial download of the metrics may take a while.