Fig. 5
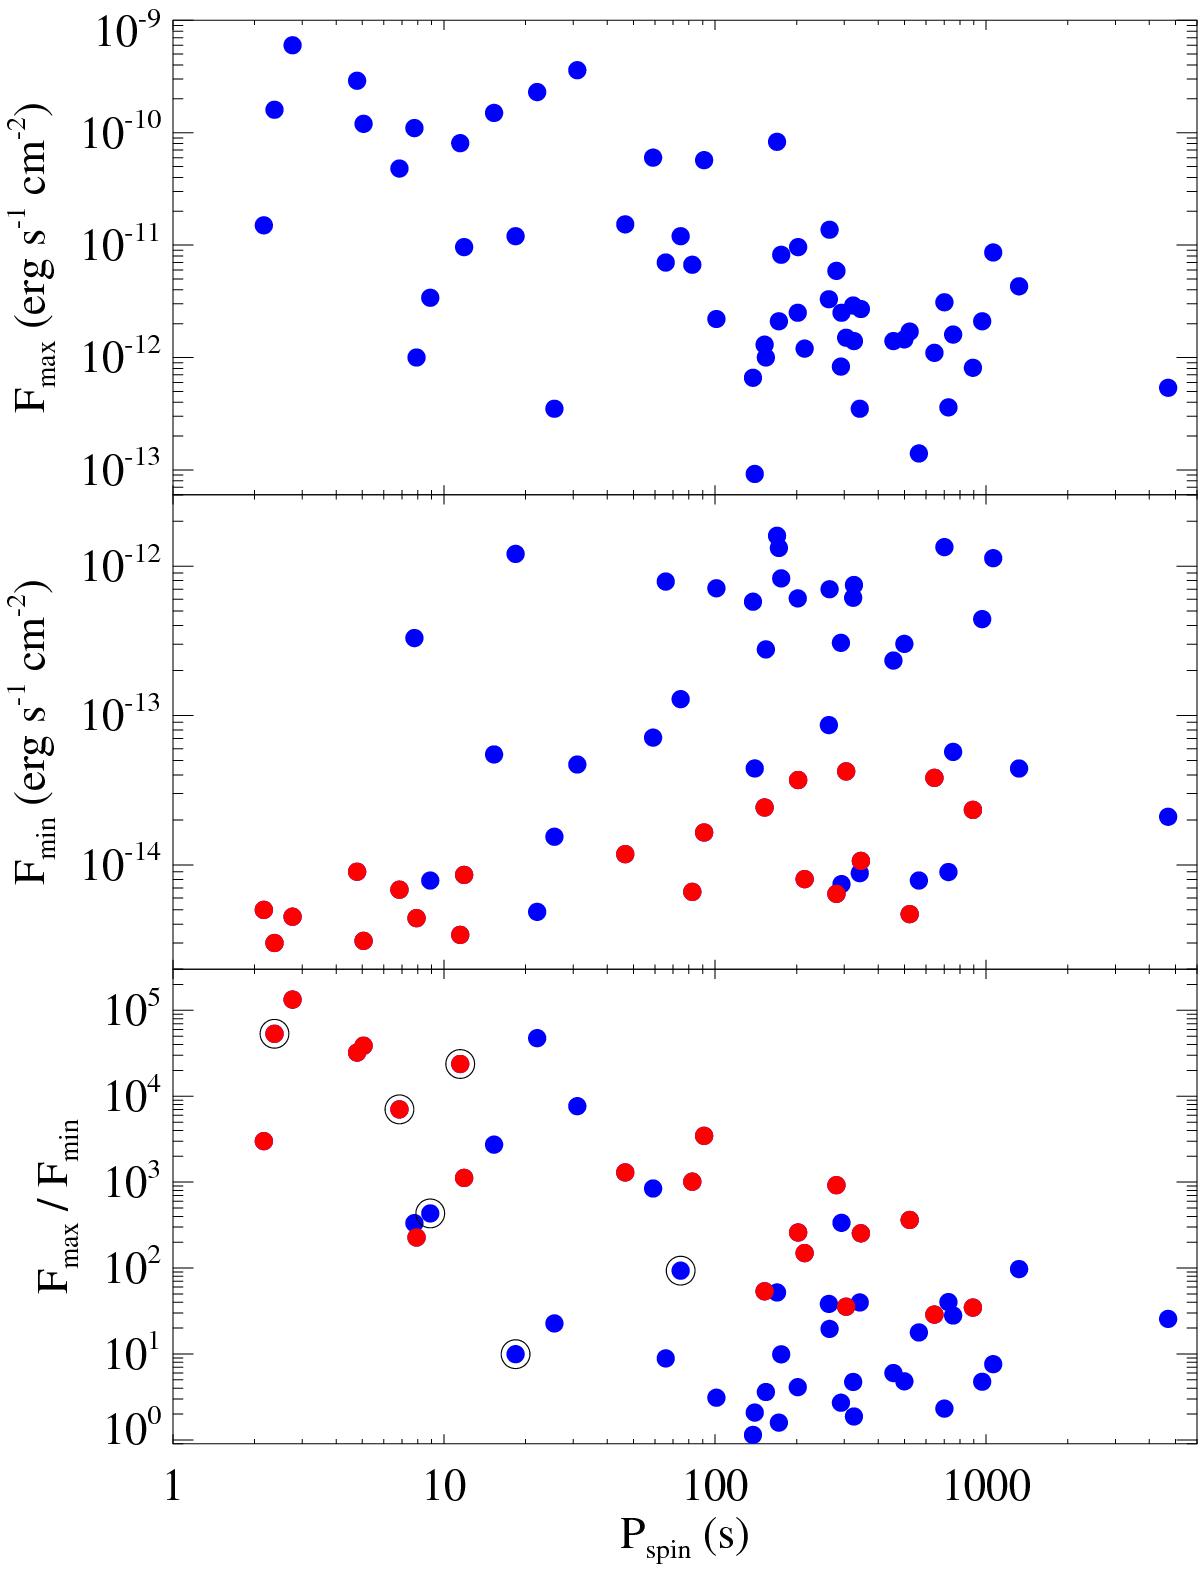
Observed maximum (top) and minimum (middle) X-ray flux together with their ratio (bottom) as function of spin period. When sources were not detected in a second observation, available upper limits were used for the minimum flux (marked in red). Black circles in the bottom panel indicate the BeXRBs with measured orbit eccentricity.
Current usage metrics show cumulative count of Article Views (full-text article views including HTML views, PDF and ePub downloads, according to the available data) and Abstracts Views on Vision4Press platform.
Data correspond to usage on the plateform after 2015. The current usage metrics is available 48-96 hours after online publication and is updated daily on week days.
Initial download of the metrics may take a while.