Fig. 6
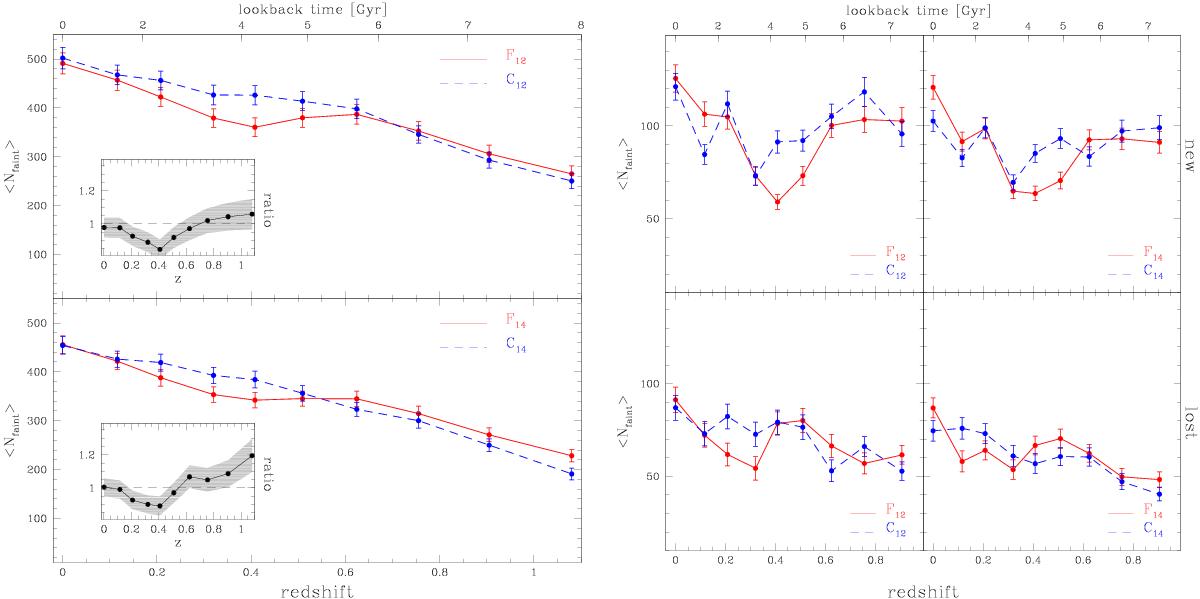
Left plot: mean number of faint galaxies in fossils (solid lines) and controls (dashed lines) as a function of redshift. The upper panel shows the evolution observed in groups defined using the ΔM12 criterion, while lower panel corresponds to groups identified according to the ΔM14 criterion. Error bars are computed using the bootstrap resampling technique. The inset panels show the ratio between the mean number of faint galaxies in fossil and control groups. Right plot: mean number of faint galaxies classified as new members (upper panels) or lost members (lower panels). Error bars are computed using the error propagation formula.
Current usage metrics show cumulative count of Article Views (full-text article views including HTML views, PDF and ePub downloads, according to the available data) and Abstracts Views on Vision4Press platform.
Data correspond to usage on the plateform after 2015. The current usage metrics is available 48-96 hours after online publication and is updated daily on week days.
Initial download of the metrics may take a while.