Fig. 5
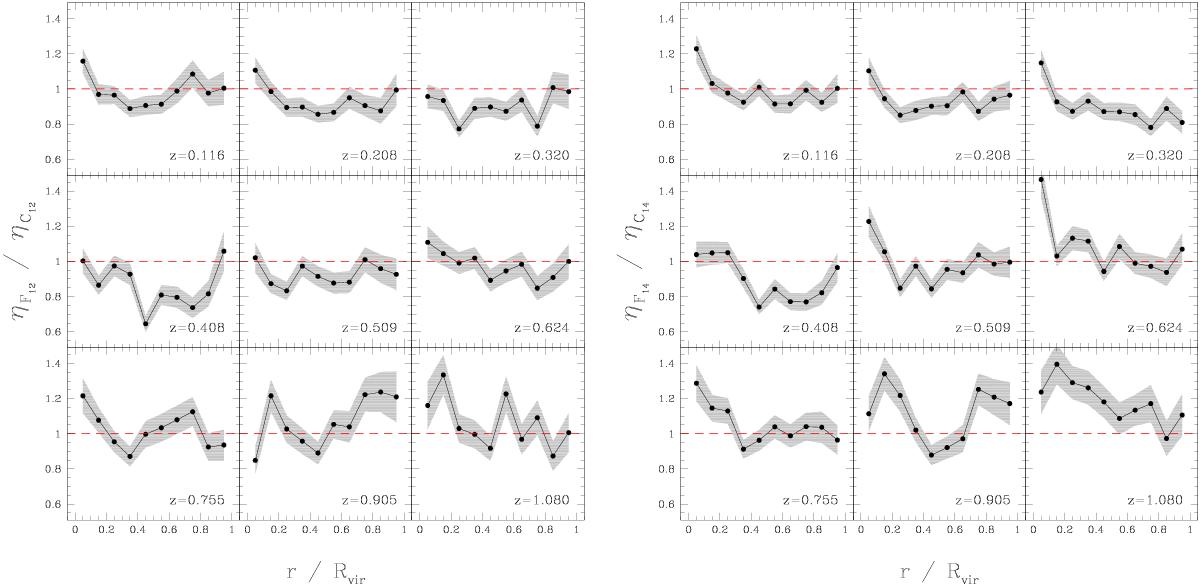
Ratios of number density profiles of faint galaxies in fossil and control groups at different evolutionary stages. The left plot shows the evolution of the ratio between the number density of faint galaxies in fossil F12 and control C12 groups as a function of the 3D normalised distance to the centre of the group. The right plot shows the same, but using fossils F14 and control C14.
Current usage metrics show cumulative count of Article Views (full-text article views including HTML views, PDF and ePub downloads, according to the available data) and Abstracts Views on Vision4Press platform.
Data correspond to usage on the plateform after 2015. The current usage metrics is available 48-96 hours after online publication and is updated daily on week days.
Initial download of the metrics may take a while.