Fig. 3
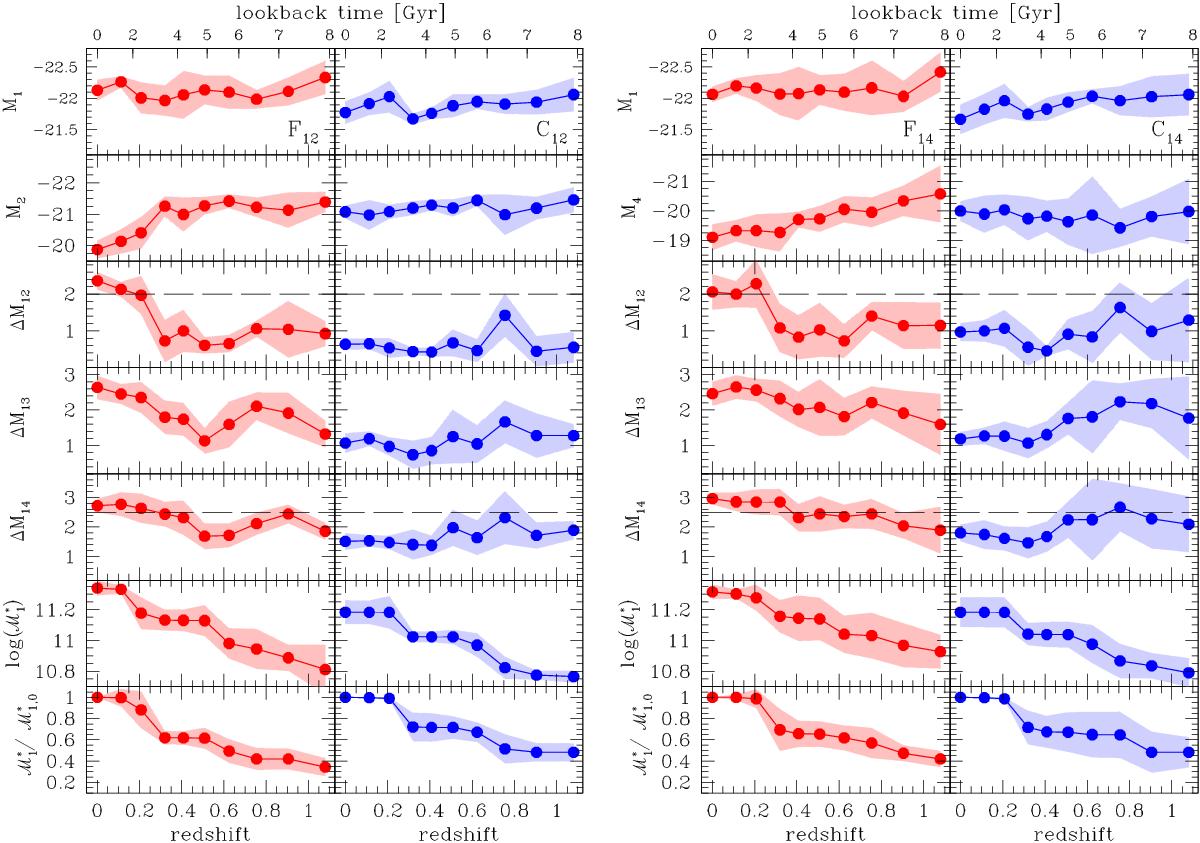
Evolution of the median properties of fossil and control groups. The left plots correspond to the sample of fossils and controls defined using the ΔM12 magnitude gap, while the right plots correspond to the definition based on the ΔM14 magnitude gap. Panels in the first row show the evolution of the r-band absolute magnitude of the brightest galaxy of the groups; the second row shows the absolute magnitude of the second and fourth brightest galaxies; the third, fourth, and fifth rows show the evolution of the r-band absolute magnitude gap between the brightest and the second, third, and fourth brightest galaxies, respectively, the dashed horizontal lines correspond to the thresholds used to define fossil groups; the sixth row shows the stellar mass of the brightest galaxy, and the last row shows the evolution of the stellar mass of the brightest galaxy normalised to its final stellar mass. Error bands are the semi-interquartile ranges.
Current usage metrics show cumulative count of Article Views (full-text article views including HTML views, PDF and ePub downloads, according to the available data) and Abstracts Views on Vision4Press platform.
Data correspond to usage on the plateform after 2015. The current usage metrics is available 48-96 hours after online publication and is updated daily on week days.
Initial download of the metrics may take a while.