Fig. 9
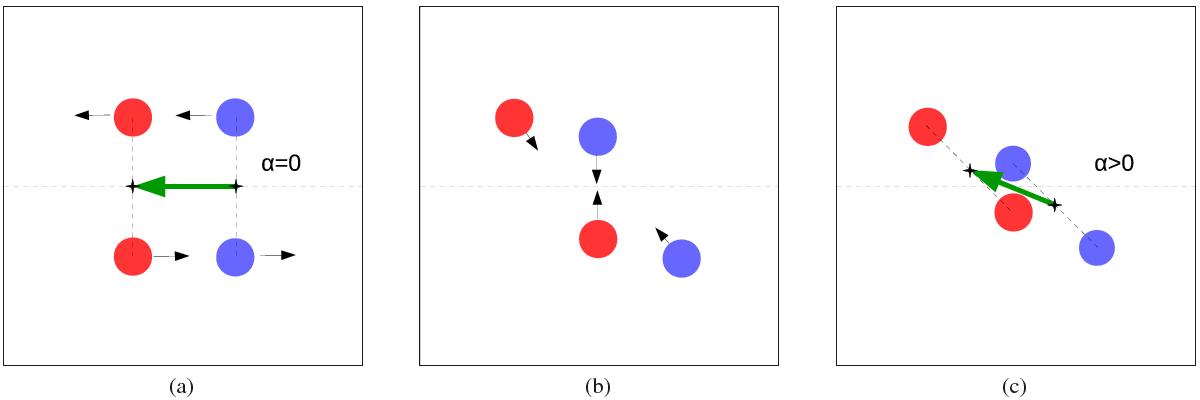
Schematic representation of the combined action of differential rotation and inflows leading to the latitudinal separation of the polarity patches giving rise to a non-zero axial dipole moment. The blue and red dots represent flux concentrations. The thin black arrows indicate plasma flows. The black plus signs indicate the location of the centers of gravity of each polarity. The thick green arrow outlines the dipole axis. a) The flux concentrations of the BMR emerge at different latitudes. b) Differential rotation shears the structure, and inflows tend to bring magnetic concentrations closer together. The effect of the inflows on the outermost concentrations is weaker. c) This displaces the centroid of the polarity patches away from the central latitude, causing the dipole axis to rotate.
Current usage metrics show cumulative count of Article Views (full-text article views including HTML views, PDF and ePub downloads, according to the available data) and Abstracts Views on Vision4Press platform.
Data correspond to usage on the plateform after 2015. The current usage metrics is available 48-96 hours after online publication and is updated daily on week days.
Initial download of the metrics may take a while.