Fig. 8
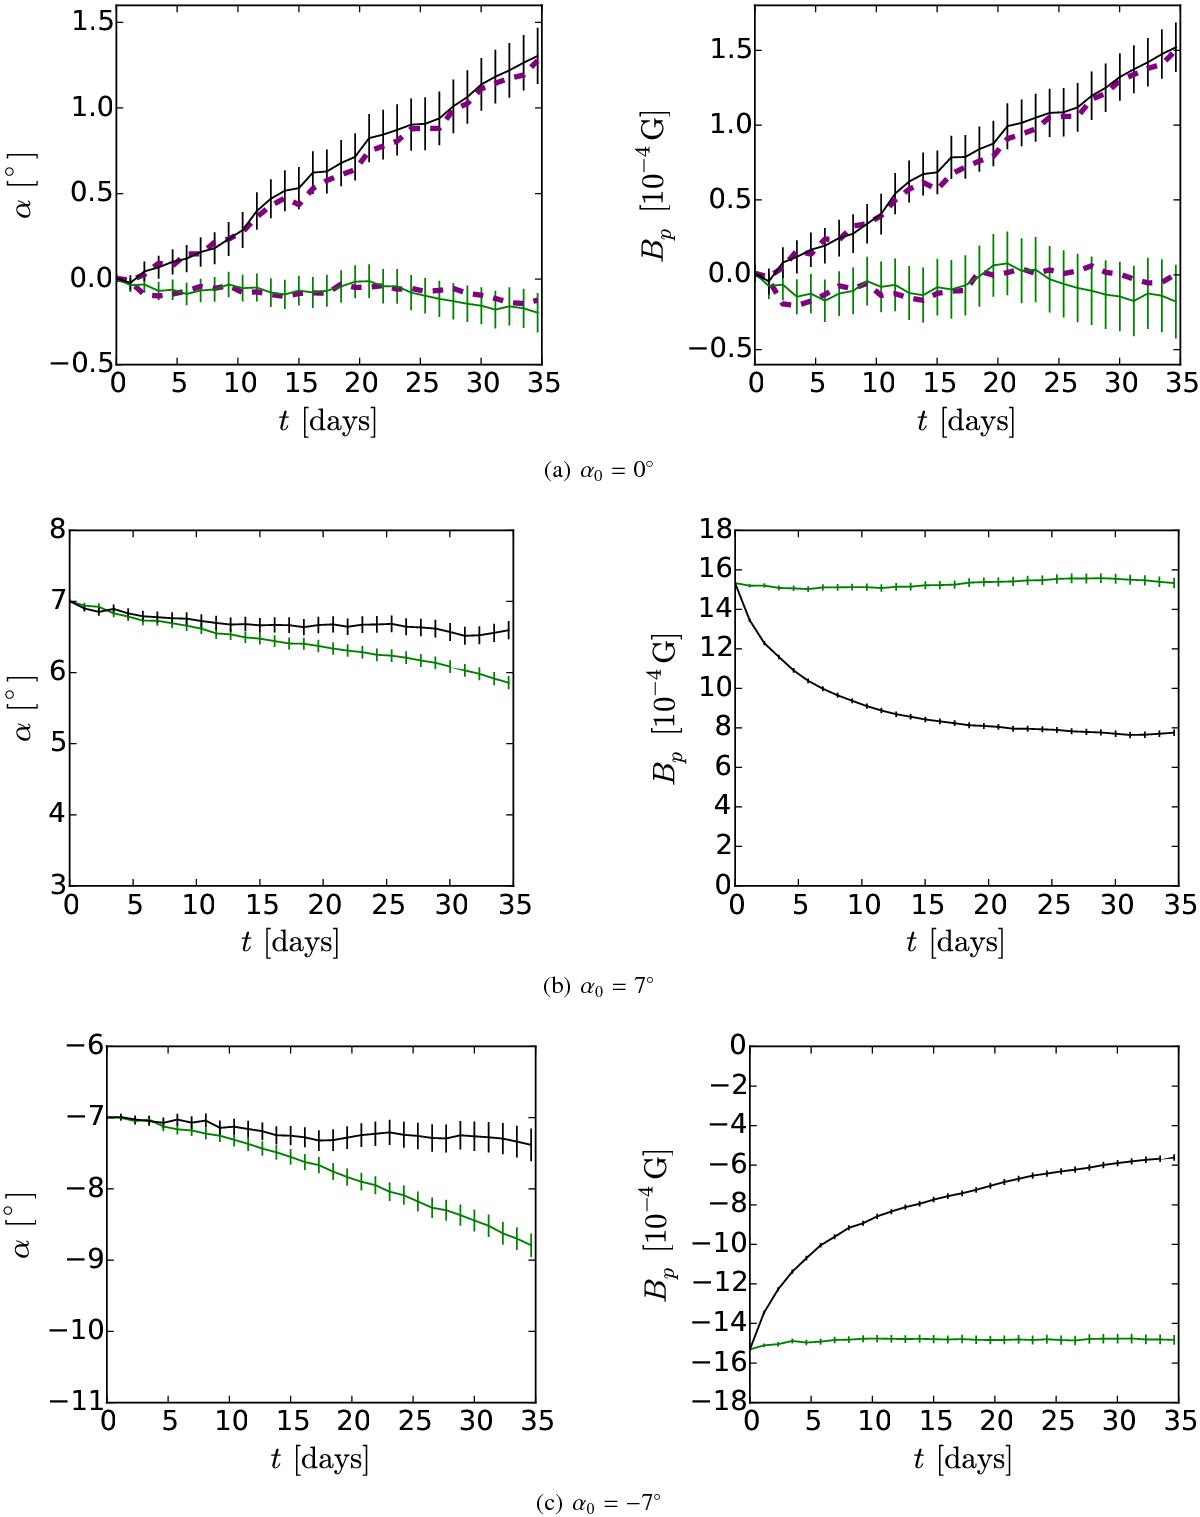
Tilt angle and axial dipole moment of a BMR placed at λ0 = 30° with an initial tilt of a) α0 = 0°, b) α0 = 7°, c) α0 = −7°. The black and green lines correspond to the simulations with and without inflows respectively. The purple dashed lines in a) correspond to simulations where the meridional flow is included (error bars have not been plotted for clarity). The error bars represent the standard error of the mean values and indicate the realization noise. The errors for different times are correlated.
Current usage metrics show cumulative count of Article Views (full-text article views including HTML views, PDF and ePub downloads, according to the available data) and Abstracts Views on Vision4Press platform.
Data correspond to usage on the plateform after 2015. The current usage metrics is available 48-96 hours after online publication and is updated daily on week days.
Initial download of the metrics may take a while.