Fig. 7
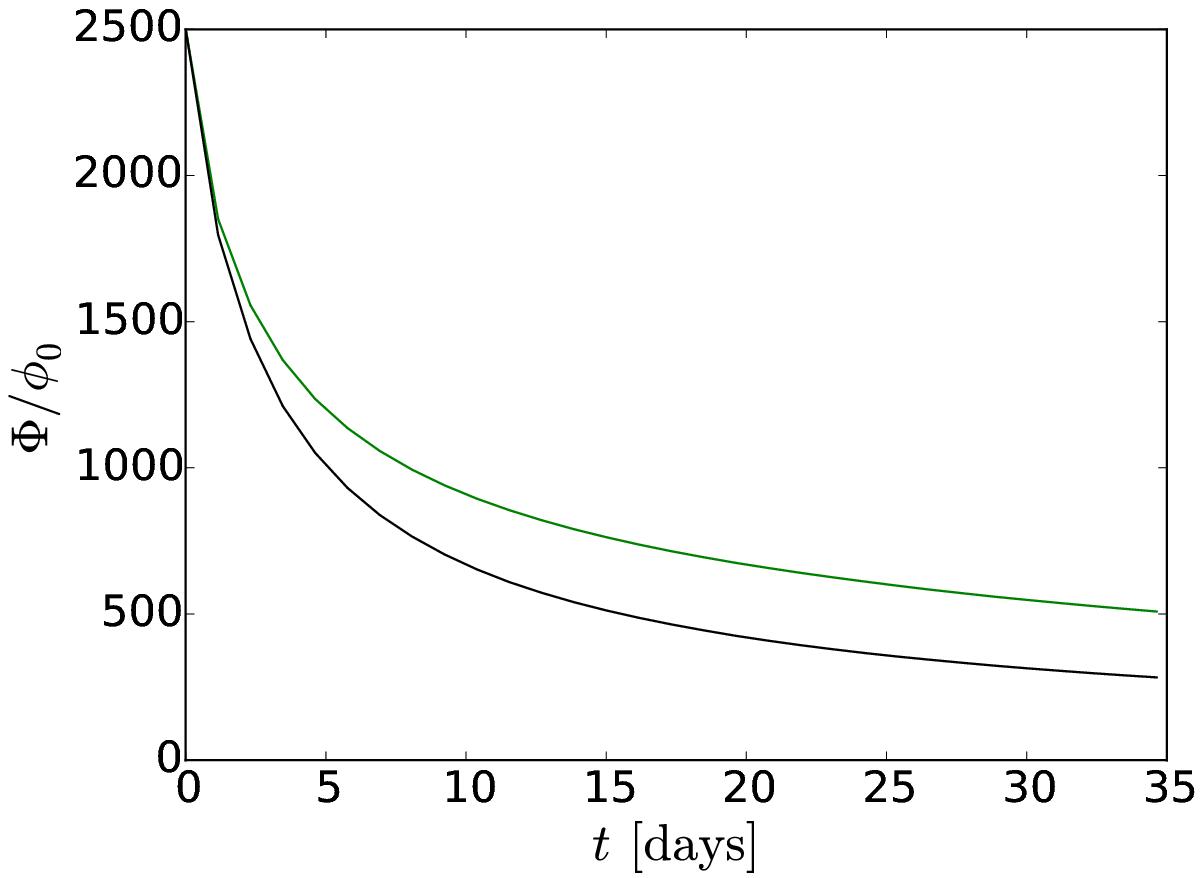
Total unsigned flux of a BMR placed at λ0 = 30° with an initial tilt of α0 = 7°. The black and green lines correspond to the simulations with and without inflows, respectively. The error bars indicating realization noise are too small to be visible. The enhanced flux destruction when inflows are present seen in the plot is very similar in all the cases studied.
Current usage metrics show cumulative count of Article Views (full-text article views including HTML views, PDF and ePub downloads, according to the available data) and Abstracts Views on Vision4Press platform.
Data correspond to usage on the plateform after 2015. The current usage metrics is available 48-96 hours after online publication and is updated daily on week days.
Initial download of the metrics may take a while.