Fig. 4
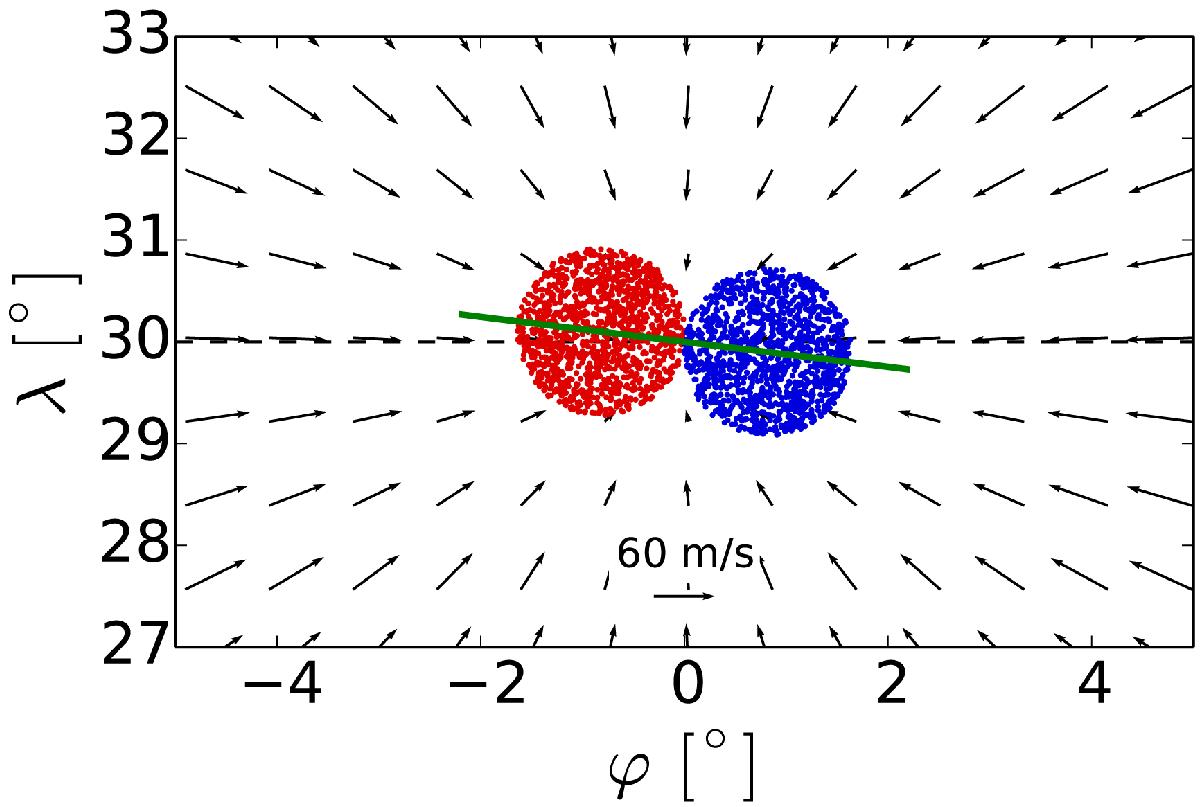
Initial distribution of magnetic flux concentrations in one of the realizations of the experiment with α0 = 7° and λ0 = 30°. The red and blue colors represent opposite polarities. The gray dashed line indicates the latitude of emergence. The solid green line indicates an angle of 7° with respect to the longitudinal direction and approximately bisects the BMR. The quiver plot represents the inflows.
Current usage metrics show cumulative count of Article Views (full-text article views including HTML views, PDF and ePub downloads, according to the available data) and Abstracts Views on Vision4Press platform.
Data correspond to usage on the plateform after 2015. The current usage metrics is available 48-96 hours after online publication and is updated daily on week days.
Initial download of the metrics may take a while.