Free Access
Fig. 3
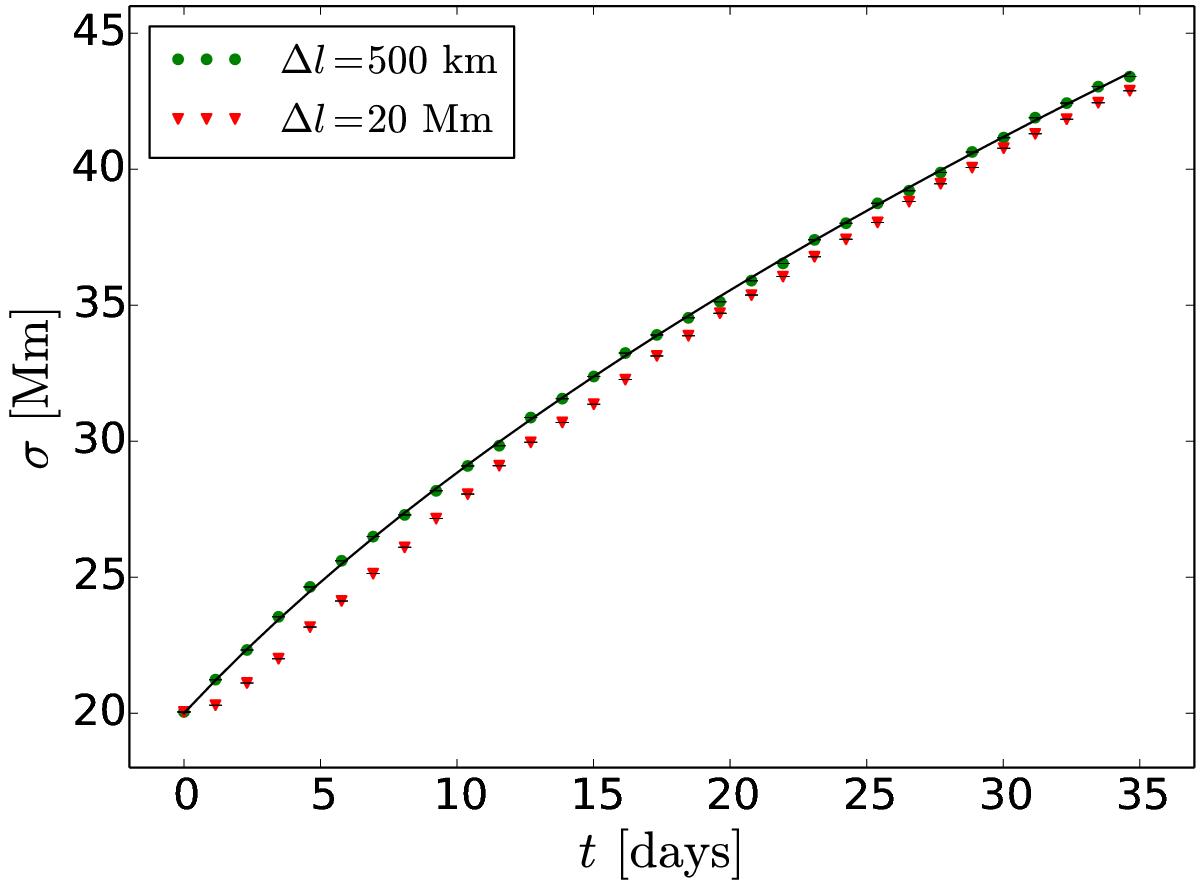
Full width at half maximum of the averaged distribution of concentrations as a function of time (symbols) compared to the spread of the equivalent diffusion process (continuous line).
Current usage metrics show cumulative count of Article Views (full-text article views including HTML views, PDF and ePub downloads, according to the available data) and Abstracts Views on Vision4Press platform.
Data correspond to usage on the plateform after 2015. The current usage metrics is available 48-96 hours after online publication and is updated daily on week days.
Initial download of the metrics may take a while.