Free Access
Fig. 2
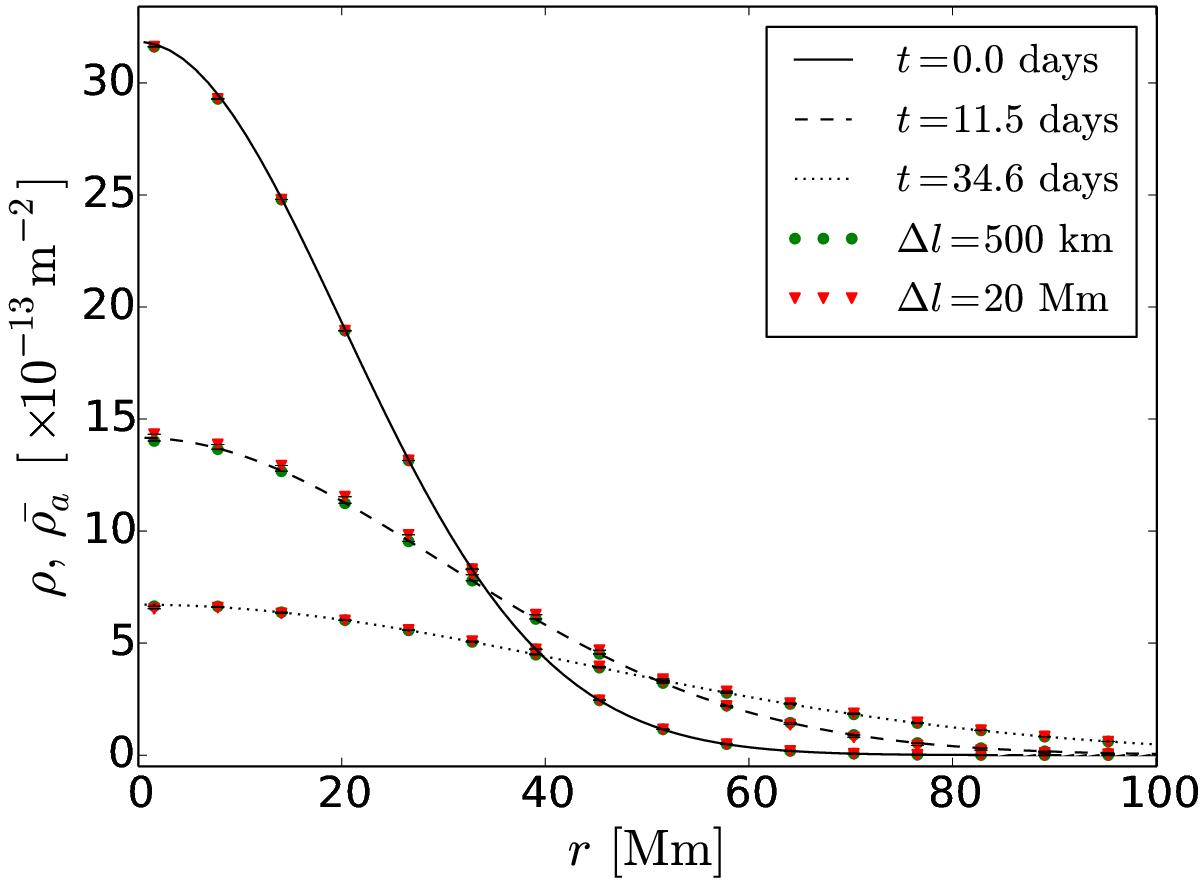
Comparison between the density distribution resulting from the diffusion equation (line plots) and the averaged number of concentrations per unit area in the simulations. The annuli used to count the concentrations are 2.5 Mm wide. Only one third of the points have been plotted for better visualization.
Current usage metrics show cumulative count of Article Views (full-text article views including HTML views, PDF and ePub downloads, according to the available data) and Abstracts Views on Vision4Press platform.
Data correspond to usage on the plateform after 2015. The current usage metrics is available 48-96 hours after online publication and is updated daily on week days.
Initial download of the metrics may take a while.