Fig. 5
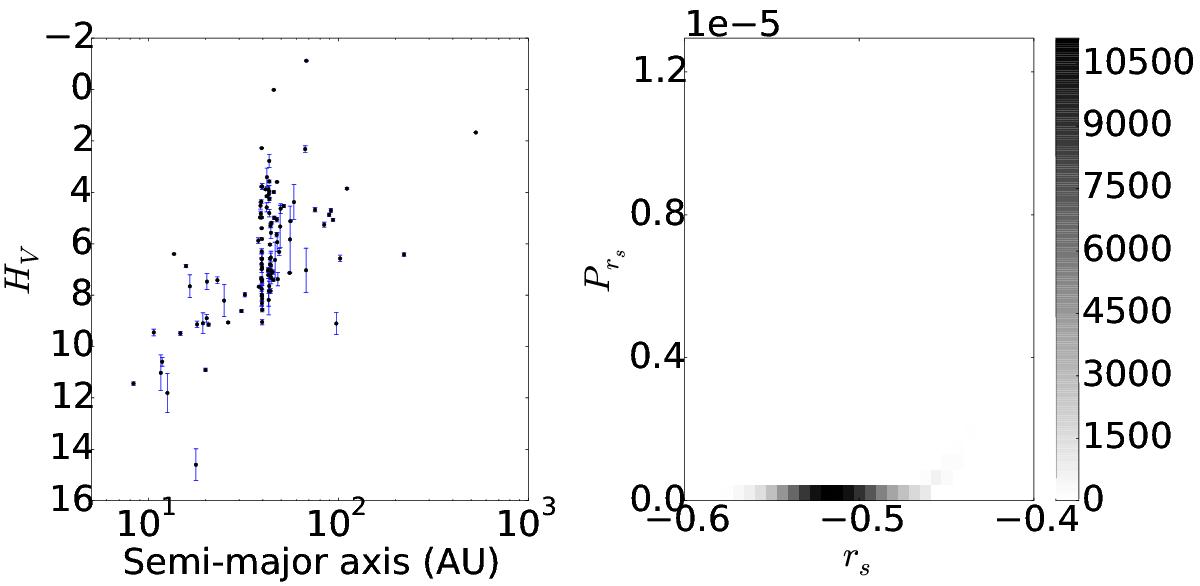
Left: scatter plot of HV vs. semi-major axis. Right: outcome of the 10 000 realizations in form of a two-dimensional histogram in rs and Prs which shows the phase space where the solutions lie. In a few cases it is relatively clear that a correlation might exists, while in some other cases large excursions are seen, which indicate that a false correlation could arise in the case of large errors.
Current usage metrics show cumulative count of Article Views (full-text article views including HTML views, PDF and ePub downloads, according to the available data) and Abstracts Views on Vision4Press platform.
Data correspond to usage on the plateform after 2015. The current usage metrics is available 48-96 hours after online publication and is updated daily on week days.
Initial download of the metrics may take a while.