Fig. A.37
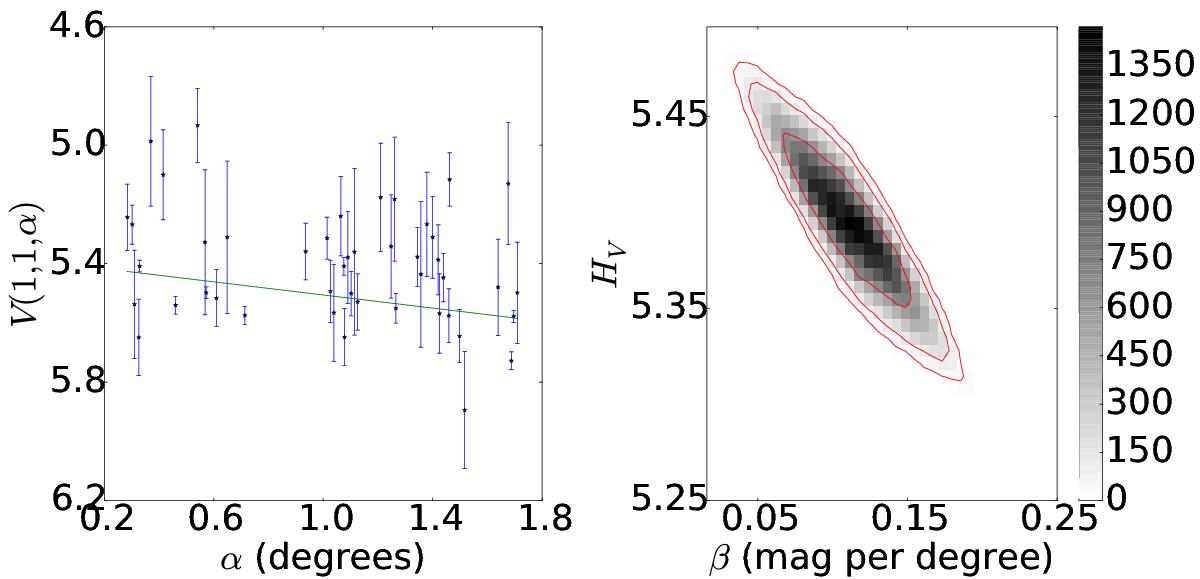
Left: phase curve of 47171 1999 TC36. The continuous line indicate the best fit to Eq. (5) resulting in HV= 5.395 ± 0.030, β = (0.111 ± 0.027) mag per degree. Right: density plot showing the phase space of solutions of Eq. (5) for Δm = 0.07, in gray scale. The continuous lines show the area that contain 68.3, 95.5, and 99.7% of the solutions.
Current usage metrics show cumulative count of Article Views (full-text article views including HTML views, PDF and ePub downloads, according to the available data) and Abstracts Views on Vision4Press platform.
Data correspond to usage on the plateform after 2015. The current usage metrics is available 48-96 hours after online publication and is updated daily on week days.
Initial download of the metrics may take a while.