Free Access
Fig. 1
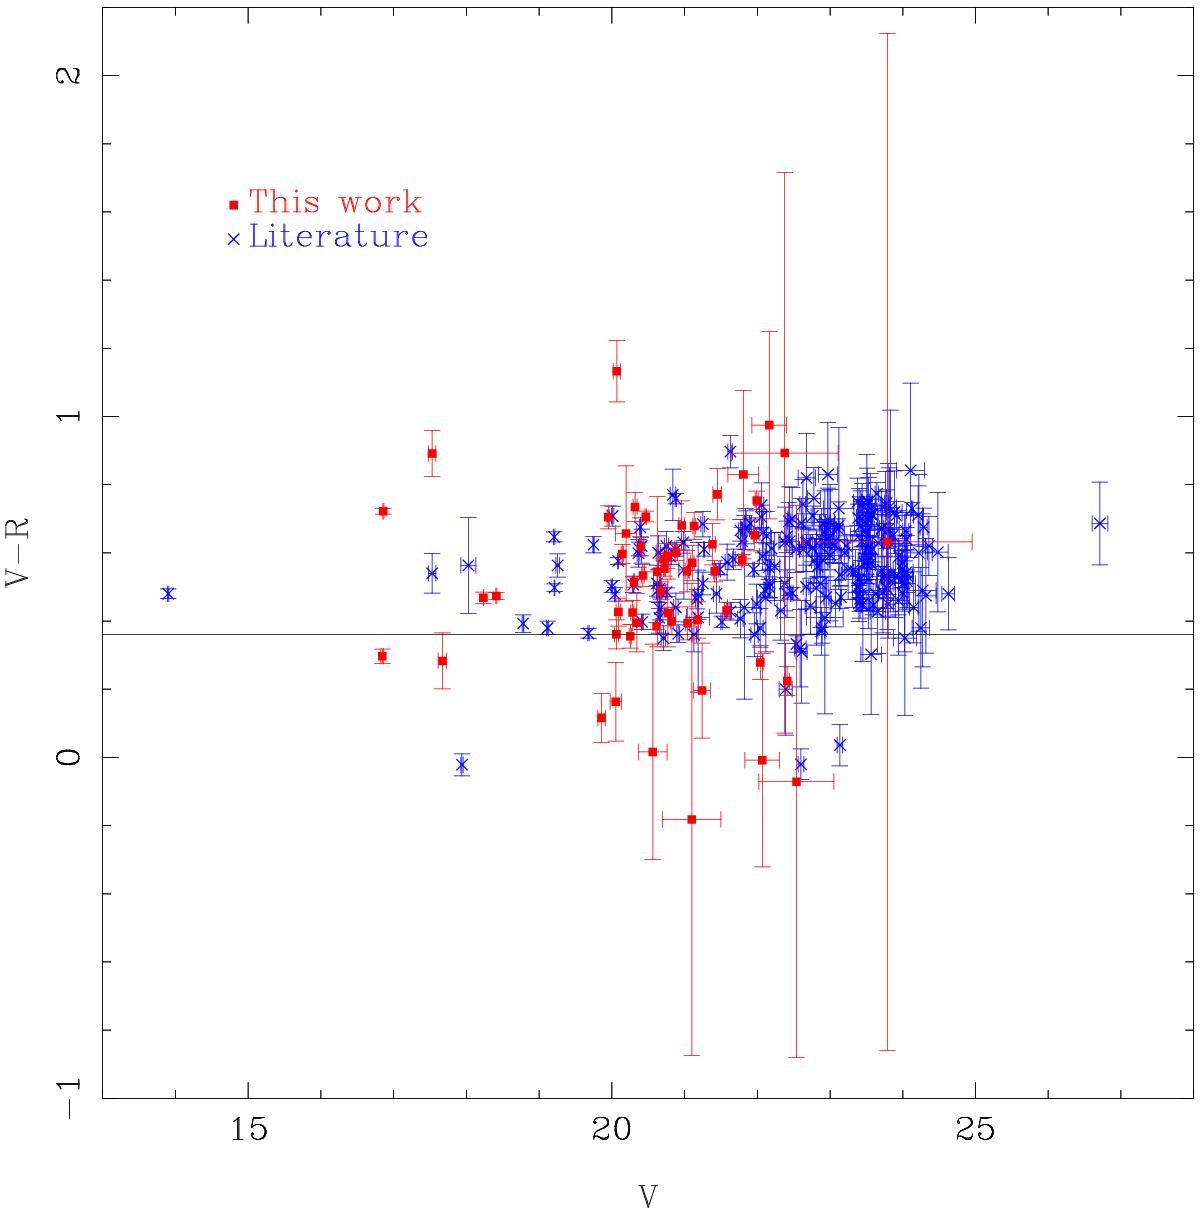
Color−magnitude diagram for the objects in our database. We show in red the objects that have at least one color measured by us, while objects whose data come from the literature alone are shown in blue. The (V−R)⊙ is shown for reference as a horizontal line.
Current usage metrics show cumulative count of Article Views (full-text article views including HTML views, PDF and ePub downloads, according to the available data) and Abstracts Views on Vision4Press platform.
Data correspond to usage on the plateform after 2015. The current usage metrics is available 48-96 hours after online publication and is updated daily on week days.
Initial download of the metrics may take a while.