Fig. 6
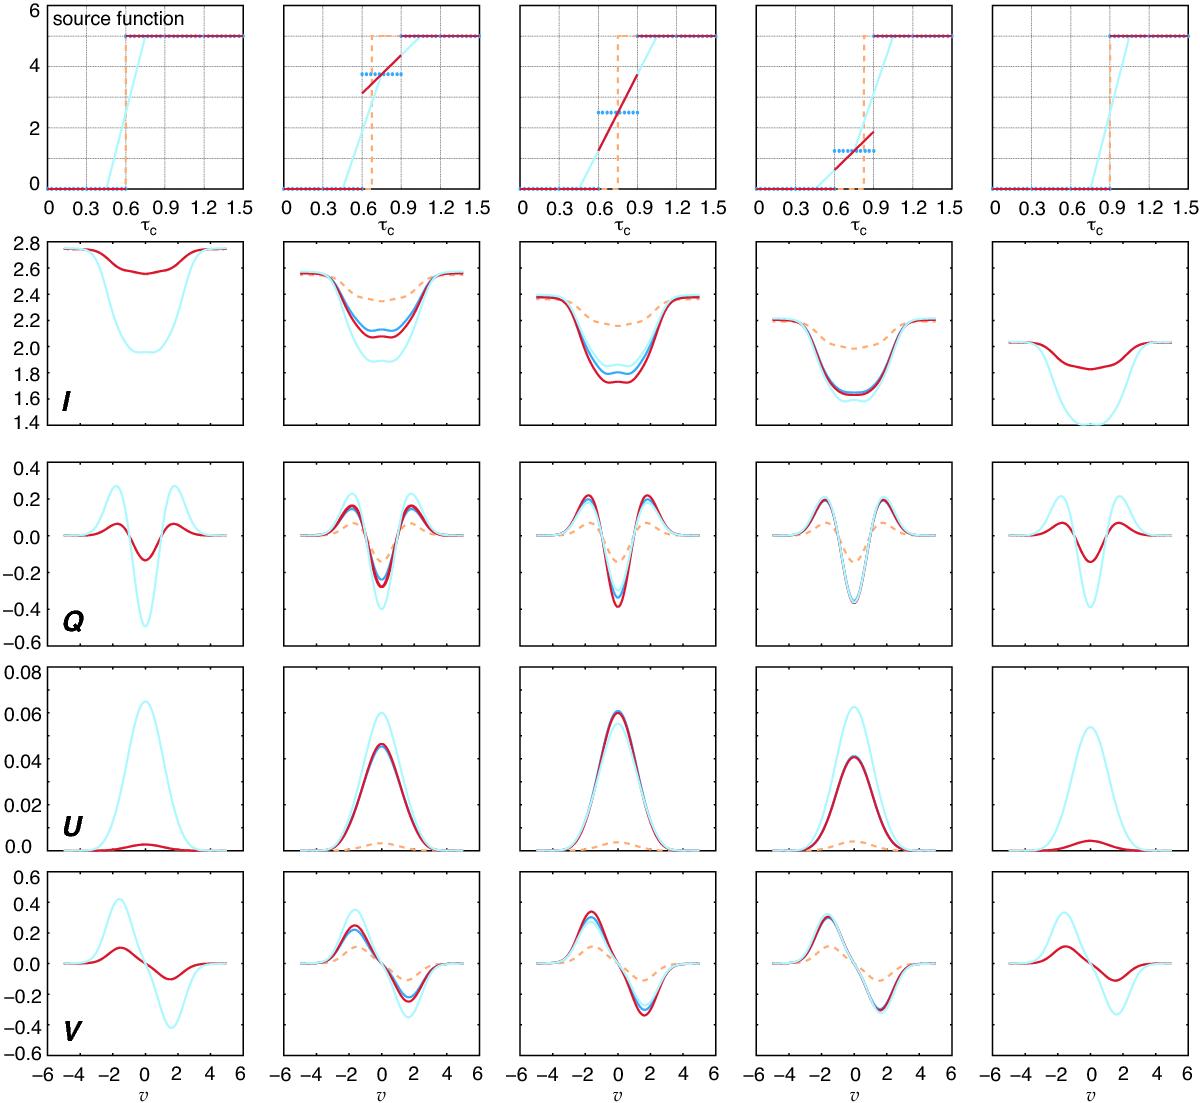
Second example. Source function (first row) and Stokes I, Q, U, and V as a function of reduced frequency v (second to fifth row, respectively) at five different positions of the discontinuity, τc = 0.6, 0.675, 0.75, 0.825, and 0.9 shown in this sequence from the first column to the last column. Each panel shows the curves for the continuous interpolation according to Eq. (32) (light blue), the piecewise constant reconstruction according to Eq. (30) (blue), the piecewise linear reconstruction with minmod slope limiter according to Eqs. (31) and (14) (red), and the reference solution (orange, dashed).
Current usage metrics show cumulative count of Article Views (full-text article views including HTML views, PDF and ePub downloads, according to the available data) and Abstracts Views on Vision4Press platform.
Data correspond to usage on the plateform after 2015. The current usage metrics is available 48-96 hours after online publication and is updated daily on week days.
Initial download of the metrics may take a while.