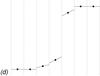
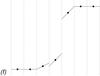
Fig. 2
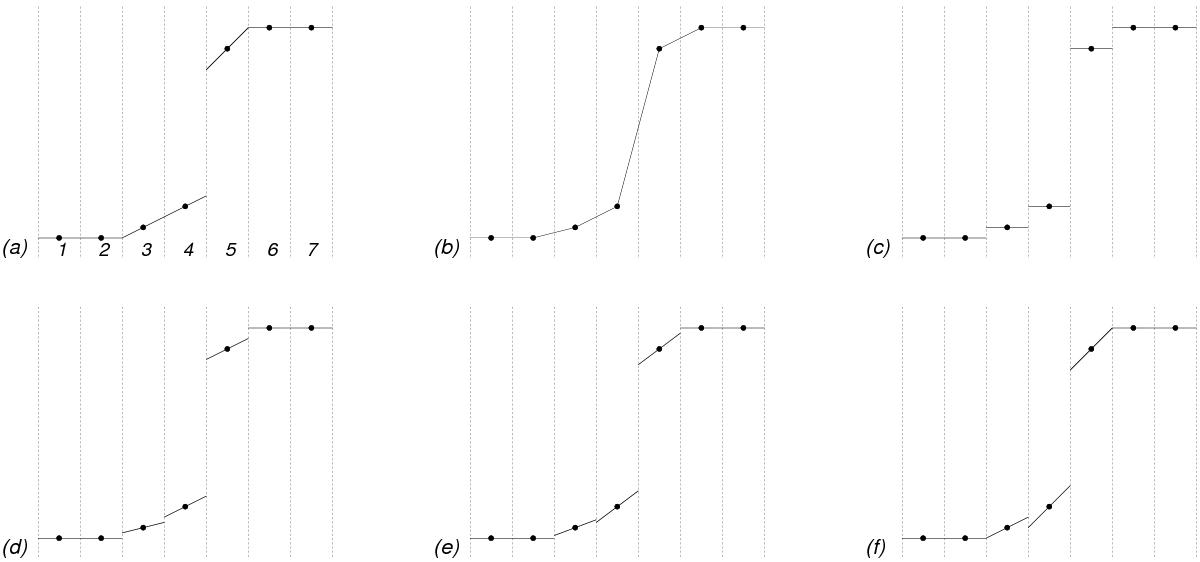
a) Initial, piecewise linear function with a single discontinuity at the interface from cell 4 to cell 5. The black dots indicate its conservative discretization (discrete grid function); b) non-conservative, continuous linear interpolation of the discrete grid function. Linear extrapolation is applied in half of the first and half of the last computational cell. c) Piecewise constant reconstruction of the discrete grid function; d) piecewise linear reconstruction using the minmod slope limiter of Eq. (14); e) piecewise linear reconstruction using the Van Leer slope limiter of Eq. (15); f) piecewise linear reconstruction using the superbee slope limiter of Eq. (16). Panels b)–f) replicate the discrete grid function (black dots) from panel a).

Current usage metrics show cumulative count of Article Views (full-text article views including HTML views, PDF and ePub downloads, according to the available data) and Abstracts Views on Vision4Press platform.
Data correspond to usage on the plateform after 2015. The current usage metrics is available 48-96 hours after online publication and is updated daily on week days.
Initial download of the metrics may take a while.