Fig. 3
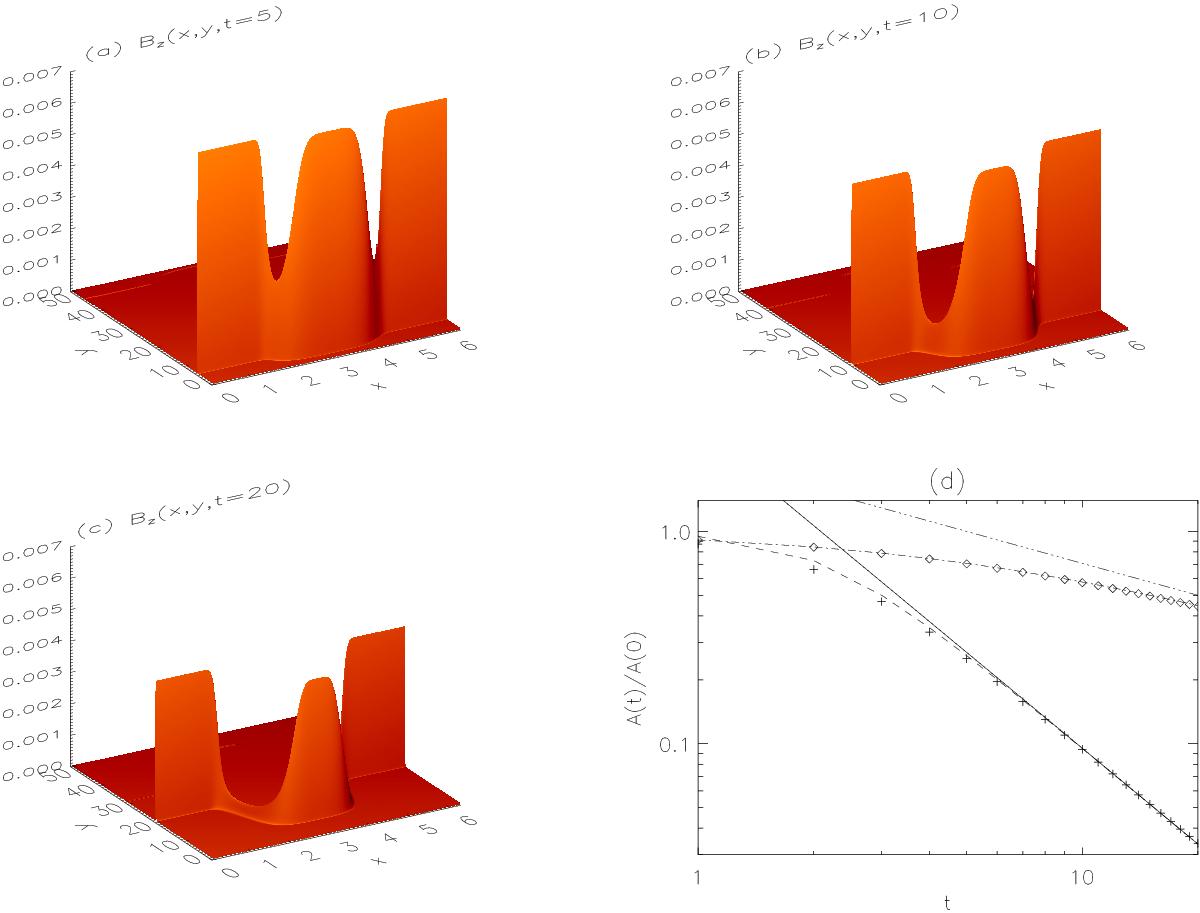
Shaded surface plots of Bz(x,y) at different times for the case without the flow D = 0. Panel a) is for t = 5; b) for t = 10; and c) for t = 20. Panel d) is time evolution of AW amplitude, normalised to its initial value, for the same case. The solid line corresponds to the asymptotic solution for large times, Eq. (22), at the strongest density gradient point x = (907 / 3000) × 2π = 1.8996. A more general analytical form Eq. (21) is plotted with dashed curve for the same x value (we actually plot Bz(1.8996,y) /α0). Crosses and open diamonds are MHD numerical simulation results in the strongest density gradient point x = (907 / 3000) × 2π = 1.8996 and away from the gradient x = (1 / 3000) × 2π = 0.0021 (the first grid cell in x-direction), respectively, by tracing the maximum value of the Gaussian AW pulse. Dash-triple-dotted line corresponds to the asymptotic solution for large times, Eq. (31), which is independent of x. A more general analytical form Eq. (30) is plotted with dash-dotted curve. It is also independent of x because at the peak of the pulse the value of exponent is unity.


Current usage metrics show cumulative count of Article Views (full-text article views including HTML views, PDF and ePub downloads, according to the available data) and Abstracts Views on Vision4Press platform.
Data correspond to usage on the plateform after 2015. The current usage metrics is available 48-96 hours after online publication and is updated daily on week days.
Initial download of the metrics may take a while.