Fig. 5
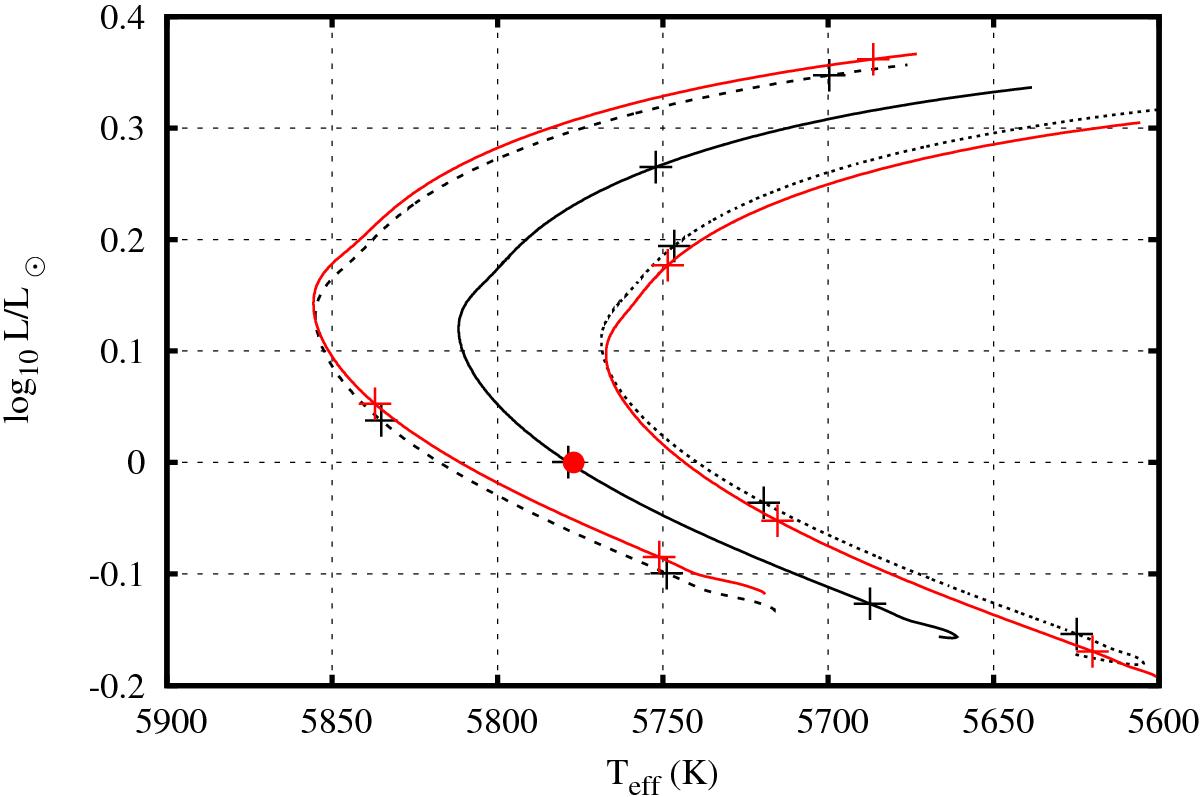
Evolutionary tracks for a 1 M⊙ model showing the effect of a small change in the hydrogen abundance. The solid line indicates the calibrated model, while the dotted and dashed lines show models where the initial hydrogen abundances has been increased and decreased by 0.01 (a change of 14% from the calibrated value) respectively. Pluses mark ages of 500 Myr, 4.57 Gyr and 10 Gyr. The red circle represents the location of the Sun. Red lines mark stellar tracks with masses of 0.98 M⊙ and 1.02 M⊙.
Current usage metrics show cumulative count of Article Views (full-text article views including HTML views, PDF and ePub downloads, according to the available data) and Abstracts Views on Vision4Press platform.
Data correspond to usage on the plateform after 2015. The current usage metrics is available 48-96 hours after online publication and is updated daily on week days.
Initial download of the metrics may take a while.