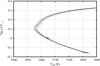
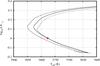
Fig. 2

Effect of different calibrations for the Sun using MESA. The solid line indicates the track for calibration performed using just the solar luminosity, temperature and Z/X. The dashed line additionally includes the depth of the solar convection zone. The dotted line includes all constraints including the rms sound speed. The red point represents the Sun. The upper panel shows tracks computed with the GS98 abundances, while the lower one shows tracks computed with the A09 abundances.
Current usage metrics show cumulative count of Article Views (full-text article views including HTML views, PDF and ePub downloads, according to the available data) and Abstracts Views on Vision4Press platform.
Data correspond to usage on the plateform after 2015. The current usage metrics is available 48-96 hours after online publication and is updated daily on week days.
Initial download of the metrics may take a while.