Fig. 8
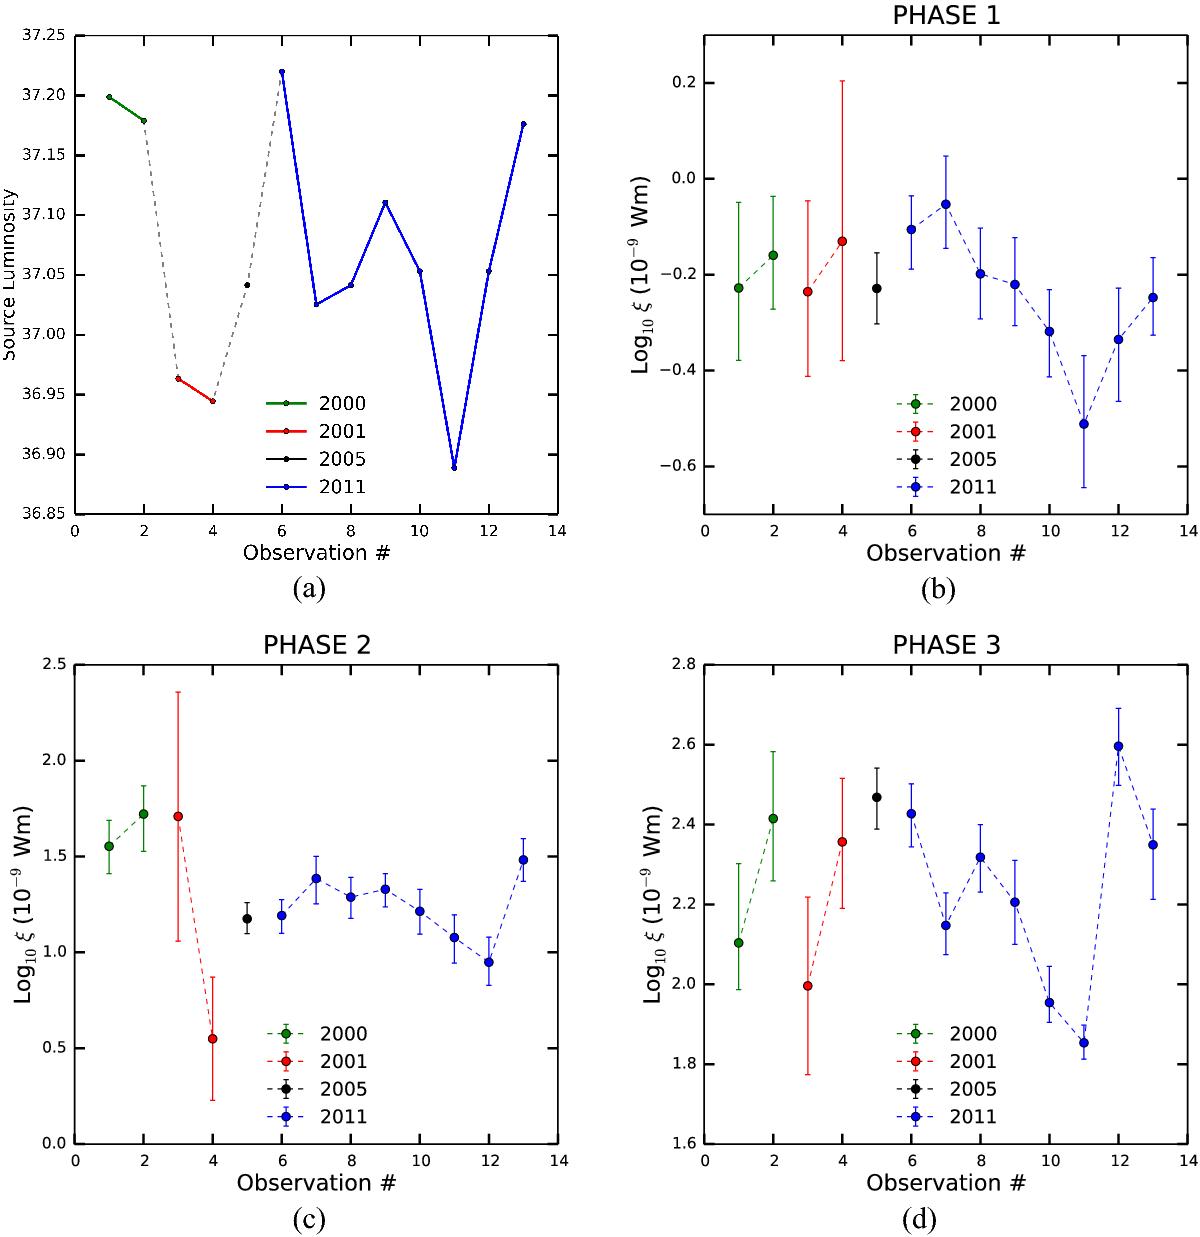
a) Based on the best-fit parameters from the stacked spectrum we derive luminosities for all the individual observations between 2000−2011. The individual data sets are highlighted and so the combined plot is not evenly spaced in time. Observation # are as in Table 1. b), c) and d) Ionisation parameter (ξ) for the individual observations derived using stacked spectrum. Compared to a) it seems ξ varies in response to changing source luminosity. The response time is related to the gas density so the component in phase 3 is possibly denser than the remaining two warm-absorbers.
Current usage metrics show cumulative count of Article Views (full-text article views including HTML views, PDF and ePub downloads, according to the available data) and Abstracts Views on Vision4Press platform.
Data correspond to usage on the plateform after 2015. The current usage metrics is available 48-96 hours after online publication and is updated daily on week days.
Initial download of the metrics may take a while.