Fig. 7
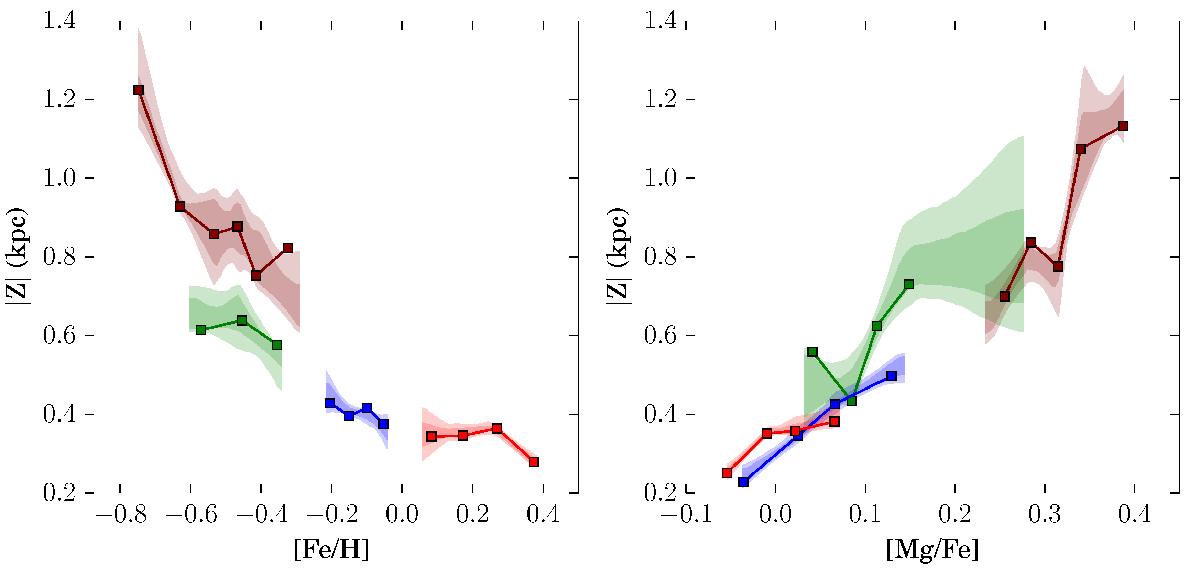
Vertical distribution of disk stars as a function of [Fe/H] and [Mg/Fe]. Colors according to the GMM groups as in Fig 2. The curve+points correspond to the median values of stars separated in bins equally populated. Error bands at the 1σ and 2σ level are computed by Monte Carlo resamplings to take into account the effect of errors in metallicity and abundances on the sample classification.
Current usage metrics show cumulative count of Article Views (full-text article views including HTML views, PDF and ePub downloads, according to the available data) and Abstracts Views on Vision4Press platform.
Data correspond to usage on the plateform after 2015. The current usage metrics is available 48-96 hours after online publication and is updated daily on week days.
Initial download of the metrics may take a while.