Fig. 3
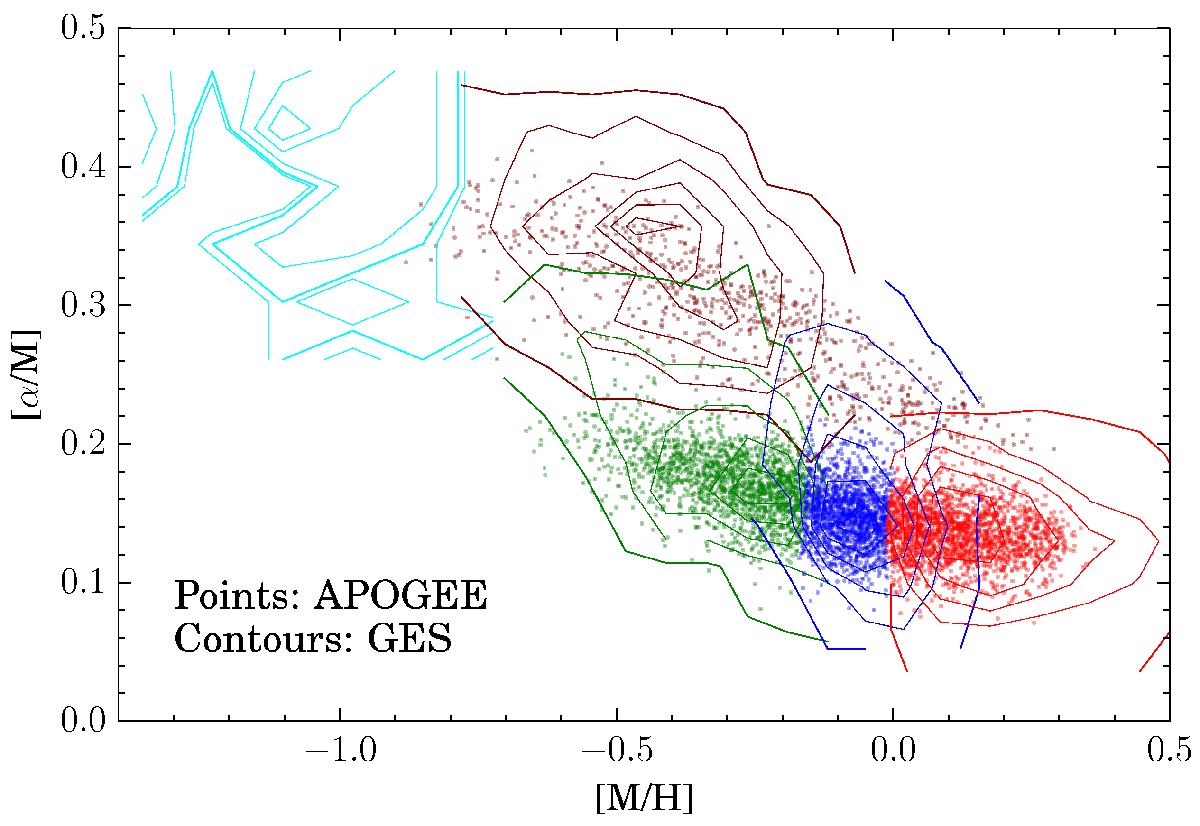
GMM decomposition of Gaia-ESO survey and APOGEE samples in the [α/M] vs. [M/H] plane. Points depict the APOGEE working sample. Contour lines draw the density distribution of Gaia-ESO survey GMM data groups. A vertical shift of Δ [α/ M] = 0.1 dex was applied to the APOGEE sample to obtain a better agreement between the two data sets. Color coding is set to be consistent with the one used to represent data groups throughout this paper.
Current usage metrics show cumulative count of Article Views (full-text article views including HTML views, PDF and ePub downloads, according to the available data) and Abstracts Views on Vision4Press platform.
Data correspond to usage on the plateform after 2015. The current usage metrics is available 48-96 hours after online publication and is updated daily on week days.
Initial download of the metrics may take a while.