Fig. 2
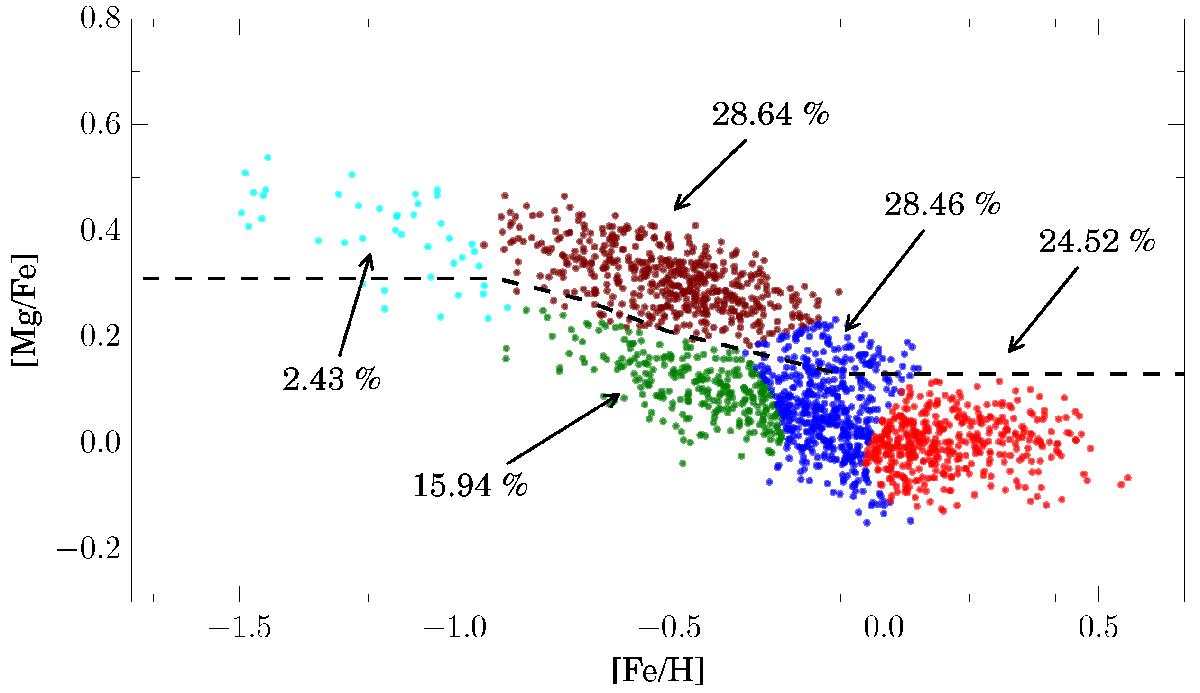
GMM best model for the GES data distribution in the [Mg/Fe] vs. [Fe/H] plane. The colors highlight the different data families corresponding to individual modes of the Gaussian mixture. Stars are classified according to the highest component-associated responsibilities. Three black dashed line segments displays the same division into thin and thick disk sequences as in Fig. 1. We quote the percentage of the sample that each component encompasses.
Current usage metrics show cumulative count of Article Views (full-text article views including HTML views, PDF and ePub downloads, according to the available data) and Abstracts Views on Vision4Press platform.
Data correspond to usage on the plateform after 2015. The current usage metrics is available 48-96 hours after online publication and is updated daily on week days.
Initial download of the metrics may take a while.